 Global| Sep 30 2008
U.S. Gasoline Prices Down Last Week, Demand Off By Most in Three Years
by:Tom Moeller
|in:Economy in Brief
Summary
The U.S. pump price for a gallon of regular gasoline fell by nine cents last week to the lowest level since early May. The decline to an average of $3.63, according to the U.S. Department of Energy survey, was accompanied by a drop in [...]
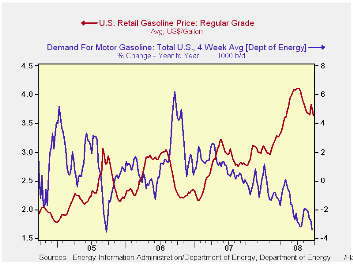
The U.S. pump price for a gallon of regular gasoline fell by nine cents last week to the lowest level since early May. The decline to an average of $3.63, according to the U.S. Department of Energy survey, was accompanied by a drop in the average price for all grades of gasoline to $3.77 per gallon.
Yesterday the spot market price for regular gasoline plunged twenty nine cents per gallon to $2.42. The drop lowered spot prices to their lowest since late this past March. In futures trading the November contract closed at $2.40 per gallon.
Weekly gasoline prices can be found in Haver's WEEKLY database. Daily prices are in the DAILY database.
According to the U.S. Department of Energy, the demand
for gasoline fell 1.8% during the last four weeks. That was
the largest weekly decline since early 2005 and for the most part
reflected the seasonal decline in driving. The weakness in gasoline
demand goes beyond that, however, and it was down 3.4% y/y, also the
most since mid-2005.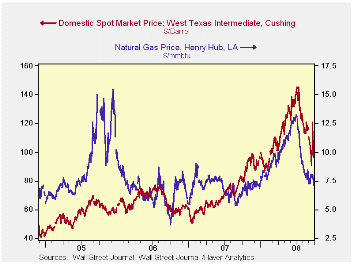
The DOE figures are available in Haver's OILWKLY database.
The price for a barrel of West Texas Intermediate crude oil rose last week to an average $110.31 per barrel, still down from the high in July of $145.66. Damage to oil rigs from Hurricane Ike was again responsible for the increase. WTI crude prices were down to $96.38 /bbl. yesterday.
Yesterday, the futures price for crude oil also stood at $96.37 per barrel.
Last week, prices for natural gas fell slightly to an average $7.75 per mmbtu (+22.8% y/y). Prices fell further yesterday to $7.14/mmbtu. The high for natural gas prices was in early July at $13.19/mmbtu.
| Weekly Prices | 09/29/08 | 09/22/08 | Y/Y | 2007 | 2006 | 2005 |
|---|---|---|---|---|---|---|
| Retail Regular Gasoline ($ per Gallon) | 3.63 | 3.72 | 30.3% | 2.80 | 2.57 | 2.27 |
| Light Sweet Crude Oil, WTI ($ per bbl.) | 110.31 | 97.29 | 34.4% | 72.25 | 66.12 | 56.60 |
by Tom Moeller September 30, 2008

The S&P/Case-Shiller Composite 20 home price index during July fell another 0.9% after a 0.5% decline during June. Since the peak in July 2006 prices have fallen 19.5% and by 16.3% during the last twelve months. The series dates back only to 2000. The decline in July prices was about as expected.
The Case-Shiller index of 20 U.S. cities and their surrounding areas is weighted to reflect price changes due to extensive remodeling, adding a home addition or extreme neglect. For example, smaller weights are assigned to sales of homes that have undergone extensive remodeling.
The Case-Shiller composite index of homes in 10 metropolitan areas, which has a longer history and dates back to 1987, fell 1.1% in July and was down 17.5% year-to-year.
Home prices in Las Vegas, Nevada continued to fall and they
were down 29.9% y/y. Prices in Miami also were off 28.2% and home
prices in Los Angeles fell 26.2%. In Phoenix prices were off 29.3%, in
San Diego prices fell 25.0% y/y and they were down 24.8% in San
Francisco. Prices in Tampa Florida posted a 19.4% y/y decline.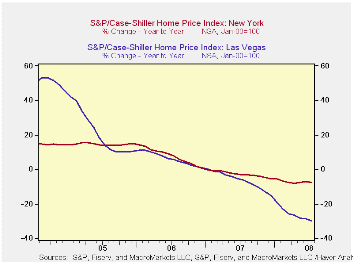
In New York prices fell a lesser 7.4% and they were down 5.4% in Boston. In Dallas prices also were off a modest 2.5% and by only 1.8% in Charlotte, North Carolina.
The S&P/Case-Shiller home price series can be found in Haver's USECON database but the city data is in the REGIONAL database.
The latest press release from Standard & Poor's can be found here.
An overview of the S&P/Case-Shiller home price series can be found here.
How Much Have U.S. House Prices Fallen? from the Federal Reserve Bank of St. Louis is available here.
| S&P/Case-Shiller Home Price Index (NSA, Jan 00 = 100) | July | June | Y/Y | 2007 | 2006 | 2005 |
|---|---|---|---|---|---|---|
| 20 City Composite Index | 166.23 | 167.71 | -16.3% | -3.8% | 7.6% | 15.8% |
by Tom Moeller September 30, 2008
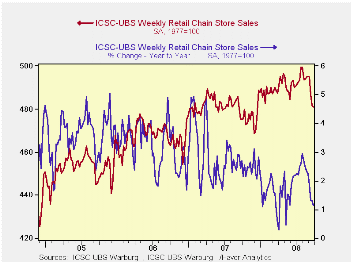
According to the International Council of Shopping Centers, chain store sales inched down another 0.2% last week. It was the fourth consecutive weekly decline and it lowered the average level of September sales by 1.9% from August.
The level of sales during the latest week was the lowest since December of last year. Year-to-year growth in sales eased to 1.1% from the recent peak growth rate of 2.9%. During the last ten years there has been a 45% correlation between the y/y change in chain store sales and the change in nonauto retail sales less gasoline.The ICSC-UBS retail chain-store sales index is constructed using the same-store sales (stores open for one year) reported by 78 stores of seven retailers: Dayton Hudson, Federated, Kmart, May, J.C. Penney, Sears and Wal-Mart.
The leading indicator of chain store sales from ICSC-UBS reversed all of the prior week's rise and fell 0.7% (-4.4% y/y) to the highest level since mid-July.
The chain store sales figures are available in Haver's SURVEYW database.
| ICSC-UBS (SA, 1977=100) | 09/27/08 | 09/20/08 | Y/Y | 2007 | 2006 | 2005 |
|---|---|---|---|---|---|---|
| Total Weekly Chain Store Sales | 480.9 | 481.7 | 1.1% | 2.8% | 3.3% | 3.6% |
by Tom Moeller September 30, 2008

For September, the Chicago Purchasing Manager's Association reported that its business barometer dipped. However, the 2.1% decline in the index to 56.7 reversed only a small part of its 14.0% m/m jump during August. Consensus expectations had been for a larger decline to a level of 53.0.
During the last ten years there has been a 67% correlation between the business barometer and the three-month change in US factory sector industrial production. There has been an 85% correlation between the Chicago figure and the national ISM index (due for release tomorrow) and that is the highest correlation of all the regional series with the national ISM index.
The largest decline came from the inventory sub-series. New orders and order backlogs also fell sharply. The production series reversed some of its recent gain but the employment index rose sharply to its highest level since March.
The prices paid index was roughly unchanged near its lowest level this year. During the last ten years there has been a 48% correlation between the price index and the three-month change in the finished goods PPI.
House Prices and the Stance of Monetary Policy from the Federal Reserve Bank of St. Louis is available here.
| Chicago PMI | September | August | September '07 | 2007 | 2006 | 2005 |
|---|---|---|---|---|---|---|
| Chicago PMI Business Barometer Index | 56.7 | 57.9 | 53.2 | 54.4 | 56.8 | 60.4 |
by Tom Moeller September 30, 2008
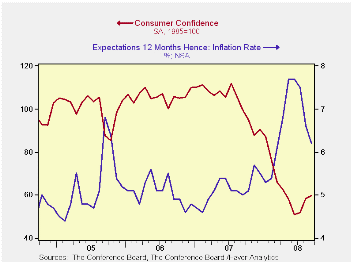
For September, the Conference Board reported that its index of consumer confidence rose 2.2% to 59.8. That followed an upwardly revised 12.7% increase during August. The latest rise contrasted with Consensus expectations for a m/m decline to a reading of 55.0. The increase clearly does not reflect the recent turbulence in the financial markets.
The rise was fueled by an 11.8% m/m increase to 60.5 in the expectations component of the index. It came on the heels of a 26.7% jump during August. The latest index level was its highest since January.
The percentage of respondents expecting business conditions to
worsen in six months fell while the percentage expecting improvement
rose to its highest level (13.5%) this year. Fewer jobs were seen by
the lowest percentage since January but a reduced 28.2% of respondents
planned to buy a major appliance within six months.
In contrast, the present conditions index again fell sharply to the lowest level since late 2003.
A slightly improved, but still negligible, 12.5% of respondents perceived that business conditions were good. That was near the lowest since early-2003. Jobs as plentiful were seen by a new low, since 2003, of 12.2% while 32.8% felt that jobs were hard to get. That was the highest since 2003.
Expectations for the inflation rate in twelve months fell again, last month to 6.2%, the lowest level since March.
| Conference Board (SA, 1985=100) | September | August | Y/Y % | 2007 | 2006 | 2005 |
|---|---|---|---|---|---|---|
| Consumer Confidence Index | 59.8 | 58.5 | -39.9 | 103.4 | 105.9 | 100.3 |
| Present Situation | 58.8 | 65.0 | -51.5 | 128.8 | 130.2 | 116.1 |
| Expectations | 60.5 | 54.1 | -40.8 | 86.4 | 89.7 | 89.7 |
by y Louise Curley September 30, 2008
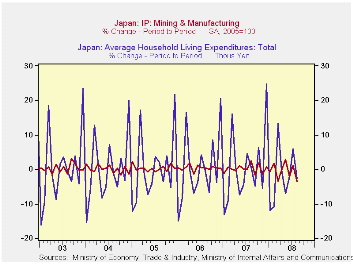 Japanese gross domestic product declined at an annual rate of
2.96% in the second quarter of this year after having risen at an
annual rate of 2.76% in the first quarter. Monthly data released
recently for the third quarter suggest another down quarter.
Japanese gross domestic product declined at an annual rate of
2.96% in the second quarter of this year after having risen at an
annual rate of 2.76% in the first quarter. Monthly data released
recently for the third quarter suggest another down quarter.
After rising 1.3% in July, Japanese industrial production declined 3.5% in August, the fastest decline in five years. The Family Income and Expenditure Survey revealed that households reduced spending in August by 4.7%. The household expenditure series, however, is extremely volatile so the year- over- year changes are, perhaps, better indicators of the trend than the month- to- month changes. The month- to- month changes in the household expenditures and in industrial production are shown in the first chart and the year- over- year changes in the second chart.
Another ominous sign is the rise in unemployment rate in August. It is now 4.2%, the highest level since June 2006 as can be seen in the third chart.


| JAPAN | Aug 08 | Jun 08 | Jul 07 | M/M % chg | Y/Y % chg | 2007 | 2006 | 2005 |
|---|---|---|---|---|---|---|---|---|
| Industrial Production (2005=100) | 104.5 | 108.3 | 109.7 | -3.51 | -4.74 | 107.1 | 104.3 | 100.1 |
| Household Expenditures (Thous Yen) | 291.3 | 299.3 | 294.0 | -2.69 | -0.94 | 297.1 | 295.3 | 300.9 |
| Unemployment (10,000 persons) | 275 | 264 | 252 | 4.17 | 91.3 | 256 | 275 | 294 |
| Unemployment Rate (%) | 4.2 | 4.0 | 3.8 | 0.2* | 0.4* | 3.9 | 4.1 | 4.4 |
| * Percentage point change | ||||||||
by Robert Brusca September 30, 2008
Headline is turning sharply in a favorable direction; core remains high and ‘sticky’
In one of my favorite comedy skits of all times Dan Aykroyd of the US TV show “Saturday Night Live” was imitating Jimmy Carter at the height of the US inflation bubble. He launched his ‘inflation is your friend’ skit urging people (while imitating Carter) to enjoy wearing $1,000 suits and living in million dollar houses and smoking $100 cigars. It was a great skit. But the view does not reflect the realities of policy.
Since those days central banks have made it a real business of stamping out inflation. But when oil prices spurt it is hard to keep a lid on inflation. Oil is just too important and people do not substitute away from it with enough vigor to damp its impact on overall prices. Central banks that target headline inflation or pose ceilings for it, have had their heads handed to them.
In the US the Fed has been criticized for its focus on CORE inflation (since people live in a headline inflation world) but, in the event, core inflation has been much more on track with the Fed’s professed comfort zone (not a formal target). And that eventually builds credibility.
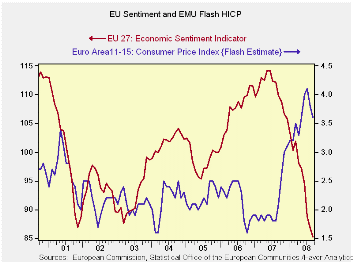
In Europe the core rate is at 2.3% over three months and six months (lagged since we do not have the core yet for September) it is in improving shape even as it is at 2.6% Yr/Yr. That’s still a percentage point better than (up-to-date) headline inflation. Had Europe focused on this rate it would regard inflation as closer to the target. Instead, while headline inflation is decelerating (0.7% annual rate over three months) it is still running at a tortuous 3.6% Yr/Yr pace that is light years away from a 2% ceiling, tying the hands of the central bank.
I am not suggesting a shift to an ‘inflation is your friend’ monetary policy. But in targeting headline inflation the ECB has boxed itself in. It is not able to be preemptive and will only be able to cut rates once economic weakness is clearly in train and that will make the hammer of economic downturn hit harder.
When this is all over the ECB would do well to reconsider what
it targets. As a general rule it makes no sense to target something you
cannot hit or will not hit. And a headline inflation rate of 2% ‘MAX’
with oil prices moving as they have is something no central bank in the
world would try to hit. Europe needs to do some re-thinking to avoid a
policy re-stinking.
| Trends in EMU HICP; Flash Index | |||||||
|---|---|---|---|---|---|---|---|
| % mo/mo | % saar | ||||||
| Sep-08 | Aug-08 | Jul-08 | 3-Mo | 6-Mo | 12-Mo | Yr Ago | |
| EMU-13 | 0.1% | -0.1% | 0.2% | 0.7% | 2.4% | 3.6% | 2.1% |
| Core | #N/A | 0.3% | 0.1% | 2.3% | 2.3% | 2.6% | 2.0% |
| Goods | #N/A | -0.4% | -0.9% | -3.4% | 4.0% | 4.6% | 1.2% |
| Services | #N/A | 0.3% | 0.9% | 6.0% | 4.3% | 2.7% | 2.6% |
| HICP | |||||||
| Germany | 0.2% | -0.2% | 0.4% | 1.5% | 2.1% | 3.0% | 2.6% |
| France | #N/A | -0.2% | 0.1% | 1.4% | 3.0% | 3.5% | 1.3% |
| Italy | -0.2% | 0.4% | -0.1% | 0.4% | 2.2% | 3.7% | 1.8% |
| UK | #N/A | 0.5% | 0.4% | #N/A | #N/A | #N/A | 1.7% |
| Spain | #N/A | -0.1% | 0.4% | 3.5% | 3.8% | 5.0% | 2.2% |
| Core:xFE&A | |||||||
| Germany | #N/A | 0.3% | 0.3% | 2.7% | 1.7% | 1.9% | 2.3% |
| Italy | #N/A | 0.7% | -0.2% | 3.4% | 3.2% | 3.2% | 2.0% |
| UK | #N/A | #N/A | 0.3% | #N/A | #N/A | #N/A | 1.8% |
| Spain | #N/A | 0.3% | 0.3% | 3.8% | 3.0% | 3.5% | 2.6% |
| Blue shaded area data trail by one month. | |||||||

Tom Moeller
AuthorMore in Author Profile »Prior to joining Haver Analytics in 2000, Mr. Moeller worked as the Economist at Chancellor Capital Management from 1985 to 1999. There, he developed comprehensive economic forecasts and interpreted economic data for equity and fixed income portfolio managers. Also at Chancellor, Mr. Moeller worked as an equity analyst and was responsible for researching and rating companies in the economically sensitive automobile and housing industries for investment in Chancellor’s equity portfolio. Prior to joining Chancellor, Mr. Moeller was an Economist at Citibank from 1979 to 1984. He also analyzed pricing behavior in the metals industry for the Council on Wage and Price Stability in Washington, D.C. In 1999, Mr. Moeller received the award for most accurate forecast from the Forecasters' Club of New York. From 1990 to 1992 he was President of the New York Association for Business Economists. Mr. Moeller earned an M.B.A. in Finance from Fordham University, where he graduated in 1987. He holds a Bachelor of Arts in Economics from George Washington University.
More Economy in Brief


