 Global| May 25 2021
U.S. FHFA House Price Index Again Climbs Very Rapidly
Summary
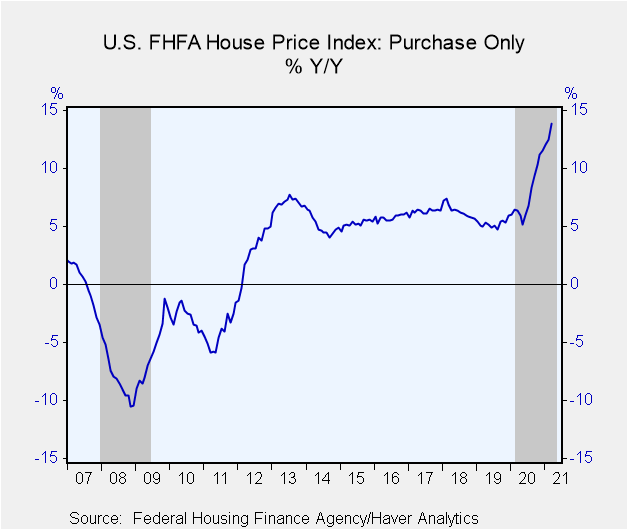
• House prices climbed 1.4% in March; February was revised up slightly. • Year-to-year move 13.9%; new high but up from low base. • All regions have participated in yearly double-digit advances. The Federal Housing Finance Agency [...]
• House prices climbed 1.4% in March; February was revised up slightly.
• Year-to-year move 13.9%; new high but up from low base.
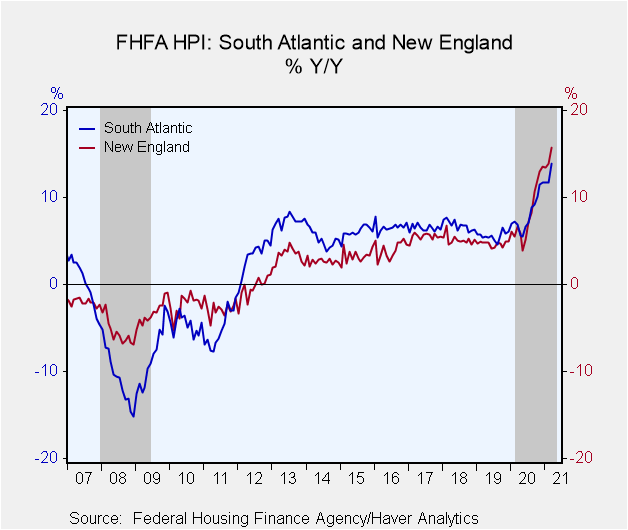
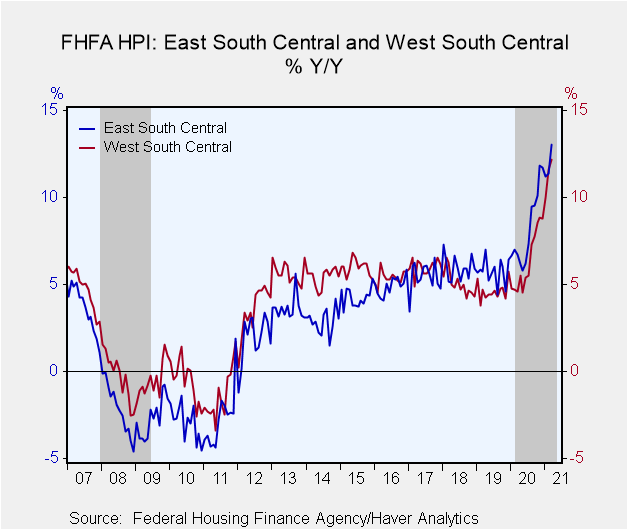
• All regions have participated in yearly double-digit advances.
The Federal Housing Finance Agency (FHFA) House Price Index surged in March by 1.44% over February, after a 1.08% advance in February. February was revised from 0.9% so that a moderation that appeared last month has now disappeared. The year-over-year move in March was 13.9%, a new record for the 12-month increase. House prices thus remain very strong, especially supported by low mortgage rates. Do note, however, that the year-to-year comparison is based in a period of particular monthly weakness in March, April and May of 2020.
For the first quarter of 2021, prices rose 3.50%. That's modestly less than 3.94% in Q4 2020, but, along with Q3 2020 at 3.44%, extends the current dramatic advance.
By region, house prices were strong everywhere. The "weakest" year-on-year gains were the West North Central and West South Central states, where prices rose only 12.2% from March 2020. The biggest year-on-year move was in the Mountain states with 17.1% over March 2020.
Month-to-month changes for March were strongest in the Mountain states – Colorado, Arizona and all others from north to south – up 2.2%, which made that area the strongest year-on-year as well, 17.1%. Notably, New England was the second strongest division, up 1.9% on the month and 15.7% from the year-ago month. Pacific states saw prices climb 15.8% y/y and 1.7% m/m.
The FHFA house price index is a weighted purchase-only index that measures average price changes in repeat sales of the same property. An associated quarterly index includes refinancings on the same kinds of properties. The indexes are based on transactions involving conforming, conventional mortgages purchased or securitized by Fannie Mae or Freddie Mac. Only mortgage transactions on single-family properties are included. The FHFA data are available in Haver's USECON database.
| FHFA U.S. House Price Index, Purchase Only (SA %) |
Mar | Feb | Jan | Mar Y/Y | 2020 | 2019 | 2018 |
|---|---|---|---|---|---|---|---|
| Total | 1.4 | 1.1 | 1.0 | 13.9 | 7.8 | 5.3 | 6.4 |
| New England | 1.9 | 1.1 | 0.7 | 15.7 | 8.2 | 4.7 | 5.2 |
| Middle Atlantic | 1.1 | 0.3 | 1.4 | 13.3 | 7.4 | 4.5 | 5.2 |
| East North Central | 1.3 | 0.9 | 0.9 | 13.1 | 7.7 | 5.4 | 6.3 |
| West North Central | 0.8 | 1.2 | 1.1 | 12.2 | 7.2 | 5.1 | 5.8 |
| South Atlantic | 1.7 | 0.7 | 1.1 | 13.8 | 8.1 | 5.6 | 6.8 |
| East South Central | 1.5 | 1.0 | 0.2 | 13.1 | 8.2 | 5.8 | 6.0 |
| West South Central | 0.9 | 1.6 | 0.9 | 12.2 | 6.4 | 4.6 | 5.1 |
| Mountain | 2.2 | 1.6 | 1.6 | 17.1 | 9.8 | 7.0 | 9.0 |
| Pacific | 1.7 | 1.6 | 1.3 | 15.8 | 8.0 | 4.6 | 7.2 |
Carol Stone, CBE
AuthorMore in Author Profile »Carol Stone, CBE came to Haver Analytics in 2003 following more than 35 years as a financial market economist at major Wall Street financial institutions, most especially Merrill Lynch and Nomura Securities. She had broad experience in analysis and forecasting of flow-of-funds accounts, the federal budget and Federal Reserve operations. At Nomura Securities, among other duties, she developed various indicator forecasting tools and edited a daily global publication produced in London and New York for readers in Tokyo. At Haver Analytics, Carol was a member of the Research Department, aiding database managers with research and documentation efforts, as well as posting commentary on select economic reports. In addition, she conducted Ways-of-the-World, a blog on economic issues for an Episcopal-Church-affiliated website, The Geranium Farm. During her career, Carol served as an officer of the Money Marketeers and the Downtown Economists Club. She had a PhD from NYU's Stern School of Business. She lived in Brooklyn, New York, and had a weekend home on Long Island.
More Economy in Brief
 Global| Feb 05 2026
Charts of the Week: Balanced Policy, Resilient Data and AI Narratives
by:Andrew Cates


