 Global| Feb 17 2009
U.S. Empire State Index Fell To ANew Low
by:Tom Moeller
|in:Economy in Brief
Summary
The February Empire State Index of manufacturing sector activity, reported by the Federal Reserve Bank of New York, fell to a new low for the series which dates back to 2001. The figure of -34.65 was down from -22.20 in January and it [...]
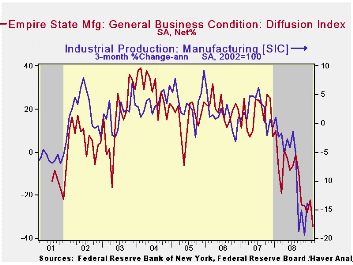
The February Empire State Index of manufacturing sector activity, reported by the Federal Reserve Bank of New York, fell to a new low for the series which dates back to 2001. The figure of -34.65 was down from -22.20 in January and it was lower than Consensus expectations for a reading of -24.0.
The figure is a diffusion index. Since the series' inception in 2001 there has been a 68% correlation between its level and the three-month change in U.S. factory sector industrial production.
The index of pricing pressure improved slightly month-to-month but it too remained near the series' low. Since inception in 2001, there has been a 77% correlation between the index of prices paid and the three-month change in the core intermediate materials PPI.
The new orders index fell sharply from January to a new series
low of -30.51. That compares to last February's reading of -10.40.Fifty
percent of survey participants reported lower levels of orders while
only twenty percent reported higher orders.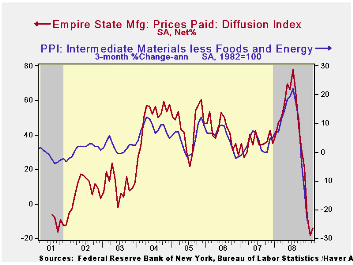
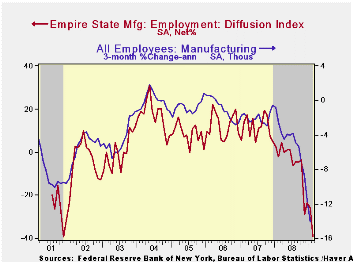
The employment index improved just slightly month-to-month but also remained near the series' low. In the history of the NY employment index, there has been an 87% correlation between it and the three-month growth in overall U.S. factory sector employment as reported by the Labor Department.
Like the Philadelphia Fed Index of General Business Conditions, the Empire State Business Conditions Index reflects answers to an independent survey question; it is not a weighted combination of the components.
The Empire State index of expected business conditions in six months fell to near the series' low. The subseries for employment collapsed and new orders remained near the series' low. The pricing index moved into negative territory.
The Empire State Manufacturing Survey is a monthly survey of
manufacturers in New York State conducted by the Federal Reserve Bank
of New York. Participants from across the state in a variety of
industries respond to a questionnaire and report the change in a
variety of indicators from the previous month. Respondents also state
the likely direction of these same indicators six months ahead.
For more on the Empire State Manufacturing Survey, including methodologies and the latest report, click here.
The Empire State data is available in Haver's SURVEYS database.
Stabilizing the Housing Market: Focus on Communities is yesterday's speech by Federal Reserve Governor Elizabeth A. Duke and it can be found here.| Empire State Manufacturing Survey | February | January | February '08 | 2008 | 2007 | 2006 |
|---|---|---|---|---|---|---|
| General Business Conditions (diffusion index, %) | -34.65 | -22.20 | -7.52 | -10.10 | 17.23 | 20.24 |
| Prices Paid | -13.79 | -18.18 | 47.37 | 46.99 | 35.64 | 41.88 |
Exports and Imports Plunge in the Euro Area as Deficit Contracts
by Robert Brusca February 17, 2009
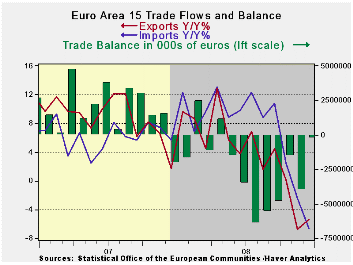
Recession has hit the Euro Area trade flows hard as exports
already lower by 6.8% lower in November fell by another 0.9% in
December. But imports that fell by 4.8% on November fell by a
further-chilling 3.9% in December. The confluence of these trends
shrank the EMU trade deficit in December to Eur 257mln from Eur 4.0 Bln
in November. Yr/Yr exports are lower by 5.4% compared to imports which
are down by 6.6%. Over three months the annual rates of decline are
-35% for exports and -43% for imports. Over the last six months the
pace of decline has accelerated sharply. Yr/yr numbers do not begin to
show the depth of the problem.
German finance minister Steinbrueck warned that Euro-region
countries may be forced to bail out other members of the 16-nation bloc
that face problems refinancing their debt. “Some countries are slowly
getting into difficulties with their payments,” Steinbrueck said late
yesterday in a speech in Dusseldorf. “The euro-region treaties don’t
foresee any help for insolvent countries, but in reality the other
states would have to rescue those running into difficulty.” This
underscores the degree of difficulty of economic times in Europe. Also
underlining that tough sledding is the warning by the rating agency
Moody’s today. Moody’s cautions that banks with substantial lending
exposure to Eastern Europe could be downgraded. Thus another class of
assets (Eastern European loans) has gone bad. Of course the banks with
the most of this type of lending are European. Emerging Europe is being
called the ‘sub-prime’ of Europe.
| Euro Area 13 - Trade trends for goods | |||||
|---|---|---|---|---|---|
| m/m% | % Saar | ||||
| Dec-08 | Nov-08 | 3M | 6M | 12M | |
| Balance* | €€ (257) | €€ (4,005) | €€ (1,922) | €€ (3,760) | €€ (2,235) |
| Exports | |||||
| All Exp | -0.9% | -6.8% | -35.3% | -17.1% | -5.4% |
| Food and Drinks | -- | -3.0% | -7.1% | -3.3% | 1.6% |
| Raw materials | -- | -13.0% | -60.4% | -34.9% | -12.2% |
| MFG | -- | -4.0% | -24.7% | -10.8% | -6.6% |
| Imports | |||||
| All IMP | -3.9% | -4.8% | -43.4% | -21.0% | -6.6% |
| Food and Drinks | -- | -2.9% | -15.1% | -7.8% | -3.7% |
| Raw materials | -- | -0.4% | 4.5% | 4.8% | 8.3% |
| MFG | -- | -0.5% | -8.2% | -1.8% | -1.3% |
| *Eur mlns; mo or period average; Gray shaded areas lag one month | |||||
German Investors Begin To See A Ray Of Hope For The Economy
by Louise Curley February 17, 2009
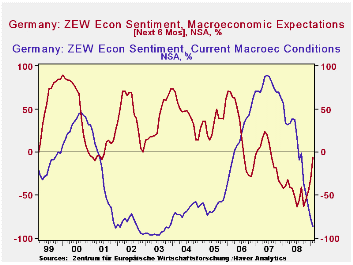
While German investors continue to see current economic conditions getting worse, they have begun to be less negative on the outlook. The German government has approved an 80 billion euro ($102 billion) stimulus program to be spent over two years. The European Central Bank, after reducing its key interest by 225 basis points since October 2008, kept the rate at 2% in February but, in his press conference on February 5, Jean-Claude Trichet, President of the Bank stated that 2% was not considered by the Governing Council to be a lower limit and that the situation would be examined at the next meeting.
These developments may have influenced the institutional
investors and analysts who participated in the latest ZEW survey which
took place between February 2 and 16.The excess of pessimists over
optimists regarding economic conditions six months ahead fell from
31.0% to 5.8%. Although the decline in pessimists regarding the outlook
is encouraging, put in perspective, it is less reassuring. It is still
negative and well below the long term average of an excess of optimists
over pessimists of 26.4%. ZEW President, Wolfgang Franz, summarized the
results of the survey as "A ray of hope--no more, no less."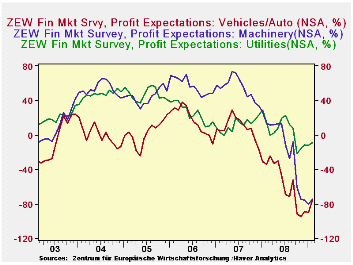
Although the investors were less negative about the prospects six months ahead, they became even more negative about current conditions. The excess of pessimist over optimists regarding current economic conditions increased from 72.1% to 86.2%.
In line with their less negative view of the outlook, the investors have become less negative about their profit expectations, but they are still far from expecting anything but lower profits. The highest expectations of profits in a -9.2% for Utilities. That is, those expecting a decrease in profits outweigh those expecting an increase by 9.2%. The worst is for Vehicles/Automobile where the excess of those expecting a decrease in profits over those expecting an increase is 75.3%. The outlook for profits in the Machinery industry is only marginally better than that for Automobiles.The excess of those expecting a decrease in profits over those expecting an increase is 74.6%. Profit expectations for the these industries are shown in the second chart.
| GERMANY | Feb 09 | Jan 09 | Dec 08 | Nov 08 | Oct 08 |
|---|---|---|---|---|---|
| ZEW Survey | |||||
| Current Conditions (% Balance) | -86.2 | -72.1 | -64.5 | -50.4 | -35.9 |
| Condition 6 Months Ahead (% Balance) | -5.8 | -31.0 | -45.2 | -53.5 | -63.0 |
| Profit Expectation (% Increase-Decrease) | |||||
| Utilities | -9.2 | -12.4 | -11.2 | -15.9 | -22.3 |
| Vehicles/Automobiles | -75.3 | -90.3 | -89.3 | -94.6 | -91.7 |
| Machinery | -74.6 | -80.1 | -75.2 | -74.8 | -61.2 |
U.S. Home Builders' Survey Ticked Up Slightly
by Tom Moeller February 17, 2009
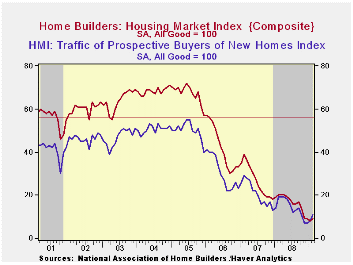
The Housing Market Index (HMI) from the National Association of Home Builders ticked up this month after having reached the record low in January. At nine the figure still was, however, less than half the year-ago figure. The index is compiled from survey questions asking builders to rate market conditions as “good”, “fair”, “poor” or “very high” to “very low”. Numerical results over 50 indicate a predominance of “good” readings.
The Home Builders Association indicated that its sub-index of present sales conditions also ticked higher to 7 from the record low reached in January. The latest figure remained well below last year's average level of 16, 2007's average of 27, 2006's average of 45 and 2005's average of 73.Since 1990, the year-to-year change in this index has had an 85% correlation with the year-to-year percentage change in new single-family home sales.
The index of builders’ expectations for sales in six months fell to a record low but the “traffic" of prospective buyers ticked up slightly for the second consecutive month from its record low.
Index readings ticked up slightly last month in each of the
country's regions except the Northeast where the index plumbed a new
low. 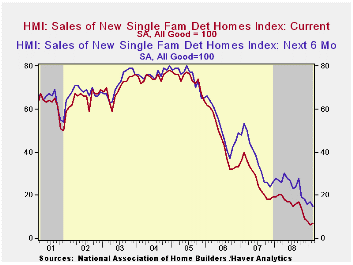
Not only are builders disturbed by the market for new homes, but the assessment of conditions for remodeling a home also reached a record low during the fourth quarter. Expectations also fell to a record low.
During the third quarter the Home Builders' Housing Opportunity Index, which is the share of homes sold that could be considered affordable to a family earning the median income, rose to its highest level since early 2004. It was up by more than one-third from the 2006 low due to lower home prices, lower interest rates and higher income.
The NAHB has compiled the Housing Market Index since 1985. The weights assigned to the individual index components are .5920 for single family detached sales, present time; .1358 for single family detached sales, next six months; and .2722 for traffic of prospective buyers. The results, along with other housing and remodeling indexes from NAHB Economics, are included in Haver’s SURVEYS database.
Credit Easing: A Policy for a Time of Financial Crisis from the Federal Reserve Bank of Cleveland is available here.
| Nat'l Association of Home Builders | February | January | February '08 | 2008 | 2007 | 2006 |
|---|---|---|---|---|---|---|
| Composite Housing Market Index (All Good = 100) | 9 | 8 | 20 | 16 | 27 | 42 |
| Single-Family Sales | 7 | 6 | 20 | 16 | 27 | 45 |
| Single-Family Sales: Next Six Months | 15 | 17 | 27 | 25 | 37 | 51 |
| Traffic of Prospective Buyers | 11 | 8 | 19 | 14 | 21 | 30 |

Tom Moeller
AuthorMore in Author Profile »Prior to joining Haver Analytics in 2000, Mr. Moeller worked as the Economist at Chancellor Capital Management from 1985 to 1999. There, he developed comprehensive economic forecasts and interpreted economic data for equity and fixed income portfolio managers. Also at Chancellor, Mr. Moeller worked as an equity analyst and was responsible for researching and rating companies in the economically sensitive automobile and housing industries for investment in Chancellor’s equity portfolio. Prior to joining Chancellor, Mr. Moeller was an Economist at Citibank from 1979 to 1984. He also analyzed pricing behavior in the metals industry for the Council on Wage and Price Stability in Washington, D.C. In 1999, Mr. Moeller received the award for most accurate forecast from the Forecasters' Club of New York. From 1990 to 1992 he was President of the New York Association for Business Economists. Mr. Moeller earned an M.B.A. in Finance from Fordham University, where he graduated in 1987. He holds a Bachelor of Arts in Economics from George Washington University.
More Economy in Brief


