 Global| Dec 23 2004
U.S. Durable Goods Orders Rebounded
by:Tom Moeller
|in:Economy in Brief
Summary
Durable goods orders rebounded 1.6% following a 0.9% decline in October that was twice the advance indication. The Consensus expectation had been for a 0.6% gain. Less transportation, orders fell 0.8% (+11.8% y/y) and added to a 1.3% [...]
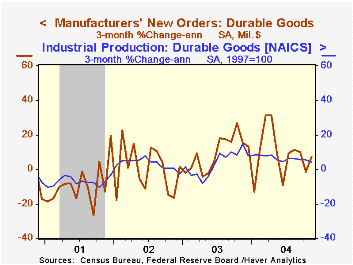
Durable goods orders rebounded 1.6% following a 0.9% decline in October that was twice the advance indication. The Consensus expectation had been for a 0.6% gain. Less transportation, orders fell 0.8% (+11.8% y/y) and added to a 1.3% decline in October.
Transportation equipment orders rose 8.2% reflecting a 41.9% spurt in aircraft & parts orders. Primary metals orders rose 3.9% (+23.6% y/y) but orders for fabricated metals eased 0.4% (+12.5% y/y).
Nondefense capital goods orders surged 8.1% m/m led by a 64.2% jump in aircraft. Excluding aircraft, orders rose 1.8% and recouped about half of the decline in October. A 4.6% (9.8% y/y) rise in orders for electrical equipment & appliances led the gain, however, that was offset by a 4.2% decline (+12.6% y/y) in orders for computers & electronic products, off for the second consecutive month. Machinery orders fell as well by 3.3% (+16.3% y/y).
Unfilled orders rose 1.2% (9.2% y/y), double the gain in October. Shipments fell for the second month in the last three so the rise in unfilled orders pulled the ratio of backlogs to shipments up sharply.
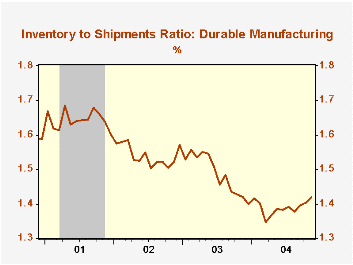
Inventories of durable goods surged 1.0% (8.3% y/y) after the 0.9% October gain which was revised up sharply. The inventory to shipments ratio rose to its highest level in a year.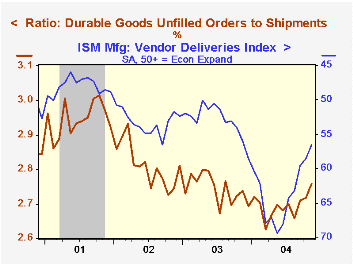
| NAICS Classification | Nov | Oct | Y/Y | 2003 | 2002 | 2001 |
|---|---|---|---|---|---|---|
| Durable Goods Orders | 1.6% | -0.9% | 9.7% | 2.6% | -1.7% | -10.5% |
| Nondefense Capital Goods | 8.1% | -3.4% | 21.2% | 5.6% | -7.2% | -15.5% |
| Excluding Aircraft | 1.8% | -4.1% | 14.3% | 6.6% | -7.1% | -12.9% |
by Tom Moeller December 23, 2004

Personal income rose a moderate 0.3% last month following the unrevised 0.6% spurt in October. Consensus expectations had been for a 0.2% rise.
The gain in wages & salaries eased to 0.2% (+4.6% y/y) after the 0.6% surge in October. Factory sector wages eked out a 0.1% (1.1% y/y) gain after falling 0.1% the prior month.
Personal disposable income rose 0.3% (4.9% y/y), half the gain in October. Disposable income growth adjusted for inflation was stable m/m at 0.2% (2.2% y/y).
Personal consumption eased as well, growing 0.2%, one quarter the rise in October. A 2.4% decline in durable goods spending reflected a 3.4% m/m drop in total sales of light motor vehicles. Spending on nondurables also eased, up 0.4% after a 1.6% spike in October. However, services spending picked up and grew 0.6% (5.6% y/y), up from the 0.4%-0.5% range of the prior three months.
The PCE chain price index rose just 0.1%, reflecting the recent decline in gasoline prices. Less food & energy prices rose 0.1% (1.5% y/y), the average for the last eight months.
"Open Mouth Operations: A Swiss Case Study" of a central bank's impact on the slope of the yield curve from the Federal Reserve Bank of St. Louis can be found here.
| Disposition of Personal Income | Nov | Oct | Y/Y | 2003 | 2002 | 2001 |
|---|---|---|---|---|---|---|
| Personal Income | 0.3% | 0.6% | 4.9% | 3.2% | 1.8% | 3.5% |
| Personal Consumption | 0.2% | 0.8% | 6.1% | 5.2% | 4.6% | 4.7% |
| Savings Rate | 0.3% | 0.1% | 1.3% | 1.4% | 2.0% | 1.8% |
| PCE Chain Price Index | 0.1% | 0.4% | 2.6% | 1.9% | 1.4% | 2.1% |
by Tom Moeller December 23, 2004
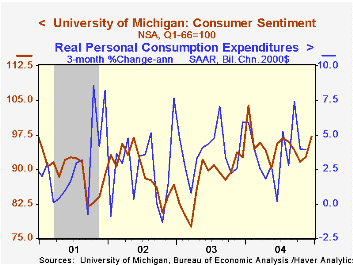
The University of Michigan's reading of consumer sentiment for the full month of December rose to 97.1, up 4.6% from November. Consensus expectations had expected 95.7.
During the last ten years there has been a 75% correlation between the level of consumer sentiment and the y/y change in real PCE.
Consumers' reading of current economic conditions rose 1.9% m/m but consumer expectations jumped 6.7%.
Sentiment amongst families earning less than $50,000 per year surged 9.5% m/m (5.3% y/y. Consumer sentiment amongst families earning more than $50,000 per year fell slightly m/m but rose 2.0% y/y.
The University of Michigan survey is not seasonally adjusted.The mid-month survey is based on telephone interviews with 250 households nationwide on personal finances and business and buying conditions. The survey is expanded to a total of 500 interviews at month end.
"Consumer Sentiment and the Media" from the Federal Reserve Bank of San Francisco can be found here.
| University of Michigan | Dec | Mid-Dec | Nov | Y/Y | 2004 | 2003 | 2002 |
|---|---|---|---|---|---|---|---|
| Consumer Sentiment | 97.1 | 95.7 | 92.8 | 4.9% | 95.2 | 87.6 | 89.6 |
| Current Conditions | 106.7 | 106.3 | 104.7 | 10.0% | 105.6 | 97.2 | 97.5 |
| Consumer Expectations | 90.0 | 88.8 | 85.2 | 1.2% | 88.5 | 81.4 | 84.6 |
by Tom Moeller December 23, 2004
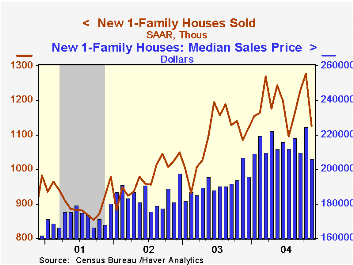
Sales of new single-family homes fell 12.0% to 1.125M last month from an upwardly revised level in October. Consensus estimates had been for a decline in sales to 1.200M.
Sales fell throughout the country except in the South where they recovered 13.6% (11.5% y/y) following a sharp decline in October.
The median price of a new single family home slipped 8.2% m/m to $206,300 (-0.4% y/y).
| Homes Sales (000s, AR) | Nov | Oct | Y/Y | 2003 | 2002 | 2001 |
|---|---|---|---|---|---|---|
| New Single-Family | 1,125 | 1,278 | 3.6% | 1,089 | 976 | 907 |
by Tom Moeller December 23, 2004
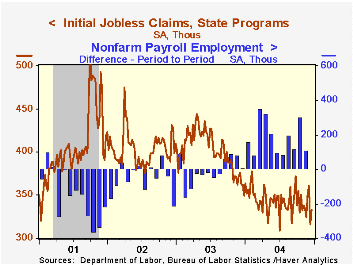
Initial unemployment insurance claims bounced up 17,000 to 333,000 last week following the sharp 45,000 drop the week prior. Consensus expectations had been for 335,000 claims.
The latest figure is for the December survey period of nonfarm payrolls and claims fell a slight 2,000 (-0.6%) from the November survey period.
The four week moving average of initial claims rose to 340,000 (-7.6% y/y).
During the last ten years there has been a (negative) 82% correlation between the level of initial claims and the y/y change in payroll employment.
Continuing claims for unemployment insurance fell another 9,000 and added to the deepened 57,000 decline the prior week.
The insured rate of unemployment remained at 2.2%, where it's been since early October.
| Unemployment Insurance (000s) | 12/18/04 | 12/11/04 | Y/Y | 2003 | 2002 | 2001 |
|---|---|---|---|---|---|---|
| Initial Claims | 333 | 316 | -8.0% | 402 | 404 | 406 |
| Continuing Claims | -- | 2,721 | -16.9% | 3,531 | 3,570 | 3,018 |

Tom Moeller
AuthorMore in Author Profile »Prior to joining Haver Analytics in 2000, Mr. Moeller worked as the Economist at Chancellor Capital Management from 1985 to 1999. There, he developed comprehensive economic forecasts and interpreted economic data for equity and fixed income portfolio managers. Also at Chancellor, Mr. Moeller worked as an equity analyst and was responsible for researching and rating companies in the economically sensitive automobile and housing industries for investment in Chancellor’s equity portfolio. Prior to joining Chancellor, Mr. Moeller was an Economist at Citibank from 1979 to 1984. He also analyzed pricing behavior in the metals industry for the Council on Wage and Price Stability in Washington, D.C. In 1999, Mr. Moeller received the award for most accurate forecast from the Forecasters' Club of New York. From 1990 to 1992 he was President of the New York Association for Business Economists. Mr. Moeller earned an M.B.A. in Finance from Fordham University, where he graduated in 1987. He holds a Bachelor of Arts in Economics from George Washington University.
More Economy in Brief


