 Global| Oct 27 2005
U.S. Durable Goods Orders Off
by:Tom Moeller
|in:Economy in Brief
Summary
A 41.6% m/m decline in nondefense aircraft orders combined with a 3.5% drop in defense aircraft bookings to pull total orders for durable goods down 2.1% last month. The 3.8% rise in August orders was upwardly revised and Consensus [...]

A 41.6% m/m decline in nondefense aircraft orders combined with a 3.5% drop in defense aircraft bookings to pull total orders for durable goods down 2.1% last month. The 3.8% rise in August orders was upwardly revised and Consensus expectations had been for a 1.2% September decline. 
Less the transportation sector altogether, durable goods orders slipped 1.0% after an upwardly revised 5.1% September jump, however, the year to year gain in orders less transportation is the same 6.0% as the gain in the total.
Total nondefense capital goods orders dropped 8.1% m/m due to the drop in aircraft but less aircraft these orders slipped a modest 1.2% following an upwardly revised 4.0% August surge.
Machinery orders increased 1.0% (7.6% y/y) on top of a 4.0% August gain and though electrical equipment orders fell 3.5% (8.4% y/y). Orders for computers & electronic products, down 3.6% (+0.9% y/y), fell hard for the second month in the last three. Computer orders fell 6.8% (+5.8% y/y).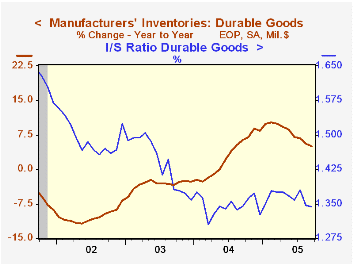
Shipments of durable goods edged up 0.1% (5.3% y/y) in September and less transportation shipments rose 0.4% (6.3% y/y).
Order backlogs rose another 0.7% (10.4% y/y) and excluding transportation backlogs jumped 1.1% (8.9% y/y). The ratio of backlogs to shipments excluding transportation rose to the highest since early 2004.
Durable inventories fell 0.1% (+5.1% y/y) following a 0.2% August decline. The momentum behind durable inventory accumulation has waned sharply to the point where the y/y gain is now half what it was earlier this year. As a result the I/S ratio for durable goods has fallen for most of this year.
| NAICS Classification | Sept | Aug | Y/Y | 2004 | 2003 | 2002 |
|---|---|---|---|---|---|---|
| Durable Goods Orders | -2.1% | 3.8% | 6.0% | 9.5% | 4.1% | -3.4% |
| Excluding Transportation | -1.0% | 5.1% | 6.0% | 11.7% | 3.1% | -6.2% |
| Nondefense Capital Goods | -8.1% | 4.1% | 8.5% | 11.0% | 4.2% | -9.8% |
| Excluding Aircraft | -1.2% | 4.0% | 5.4% | 9.5% | 4.8% | -10.5% |

Tom Moeller
AuthorMore in Author Profile »Prior to joining Haver Analytics in 2000, Mr. Moeller worked as the Economist at Chancellor Capital Management from 1985 to 1999. There, he developed comprehensive economic forecasts and interpreted economic data for equity and fixed income portfolio managers. Also at Chancellor, Mr. Moeller worked as an equity analyst and was responsible for researching and rating companies in the economically sensitive automobile and housing industries for investment in Chancellor’s equity portfolio. Prior to joining Chancellor, Mr. Moeller was an Economist at Citibank from 1979 to 1984. He also analyzed pricing behavior in the metals industry for the Council on Wage and Price Stability in Washington, D.C. In 1999, Mr. Moeller received the award for most accurate forecast from the Forecasters' Club of New York. From 1990 to 1992 he was President of the New York Association for Business Economists. Mr. Moeller earned an M.B.A. in Finance from Fordham University, where he graduated in 1987. He holds a Bachelor of Arts in Economics from George Washington University.
More Economy in Brief


