 Global| Mar 14 2007
U.S. Current Account Deficit Shrinks
Summary
Ex-petroleum import prices fell by 0.1% in February. Good news for core inflation trends. The 1Yr, 6-Mo, 3-mo progression of annualized inflation pressures also show that there is no pressure building. Yr/Yr non-petroleum import [...]
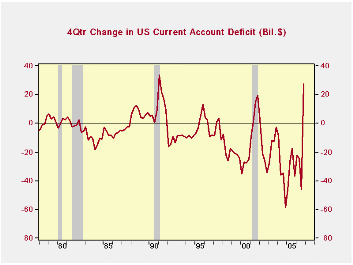 The US current account deficit is one of the most intriguing phenomena about the US economy. To understand the account is both very simple and extremely complicated. It is therefore easy to think you know nothing about it or everything at the same time! The US current account deficit is one of the most intriguing phenomena about the US economy. To understand the account is both very simple and extremely complicated. It is therefore easy to think you know nothing about it or everything at the same time!The 2006Q4 current account deficit shrank sharply to $195.8bln from $229.4bln in Q3. It also shrank compared to its $223.1bln level in 2005-Q4. And a shrinkage in the deficit over four quarters ago is unusual. (see chart on the left). Such improvement generally was induced by recession (1990, 2001, 1981,198) but also can be occasioned by significant slowdowns (1995) and the sharp dollar depreciation from its pre-Plaza Accord peak was behind the persisting improvement in the late 1980s ahead of the onset of recession. The current account is simple to understand because it is the just the difference between the value of the goods services we sell Vs the ones we buy plus a few transfer items. The US has a small positive and essentially stable balance on its services account. The trade account is the problem. Its deficit is large and persistently growing larger (see chart below on the right). 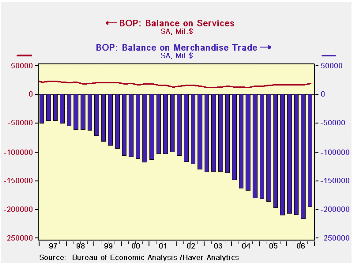 That’s the part of the current account that is easy. Now comes the hard part…understanding WHY…The ‘why’ it is difficult because some of the concepts are esoteric and also because there are different identities that describe the deficit circumstance and they have seemingly different root causes. Let me explain.One identity is that (at least conceptually) the world current account deficits across countries must balance. So if the US has a deficit at least one other country has a surplus. And, conceptually, in a world of no lags and the same accounting principles the US deficit would be the same size as the surplus for the rest of the world in total. Another is that the US current account surplus must be funded by net capital inflows of the same magnitude – this is the double entry accounting that accompanies the US balance of payments. The current account plus the capital flows that fund it are what the term ‘balance of payments’ refers to. The US has a current account deficit and an equal and opposite capital account surplus. That’s a bit more complicated framework, but still not impossible. Here is where the immovable object meets the unstoppable force: Economists argue about where the forces come from that drive the deficit. We ask, do the forces stem mostly from the current account itself or from the capital account? Does one push the other into deficit or the other push the one into surplus? Is it the current account the active mover, as profligate US consumers are overspending, or is it that miserly foreign consumer/savers under-spend and over save? Or do the main forces work though the capital account because the US is too dependent on foreign capital or is it the opposite, that foreign investors are too addicted to US investments? Here are the questions.(1) Is it US credit demand that is so huge that is draws in international capital keeping the dollar strong, hurting US competitiveness and ballooning the current account deficit as a result?(2) Is it US demand for goods that is so strong we simply consume too much and live beyond our means leading to a huge current account deficit?(3) Is it that foreign economies consume too little and do not buy enough in general and from the US in particular helping to balloon the US deficit? The flip side of low consumption is the high savings rate. Do foreigners simply save too much (Bernanke’s saving glut argument)?(4) Is the demand by foreigners for US investments so high that they push capital into the US and keep the dollar from falling so that US competitiveness is undermined and the current account deficit balloons?That’s quite a list. AND you may notice that the various arguments draw the dollar in as well.We will not solve these issues today. In any event we know that the deficit is a combination of the above points. We also know that not having a mechanism to create currency adjustment, as there was under Bretton Woods, means that deficits may not be self correcting in any timely way. Notice that despite the US deficit contraction in Q4 2006 compared to Q4 2005 the average for the year is still worsening; that is the deficit for all of 2006 was for a quarterly average of $214.2bln compared to $197.9bln in 2005. This is a full year deficit of $856.8bln for 2006 – over three quarters of a trillion dollars IN ONE YEAR in case you are counting.And if 2007 worsens as much as 2006 did our deficit will top $1trln per year in 2007. How much is one trillion? Well suppose you were to try to ‘sing the deficit down to zero’ and did so singing the tune ‘100 bottles of beer on the wall’, using the lyric ‘1trln dollars of deficit today,1trln dollars today, take one down what have you got? 999,999,999,999 dollars of deficit today’. Now assume you can sing that in 10 seconds –each verse. That’s 10 trillion seconds of singing. It would take you more than 300 years to get the current account into balance. If George Washington had started singing that song, and were he blessed with extraordinary long life, he would still being singing today...and going strong with his work still cut out for him. . Slower US growth especially on the back of reduced inventory demand helped to contain imports in 2006; that was aided by lower oil prices as well by year end. Stronger foreign growth played a role as US exports expanded briskly at a 14.5% pace against the weak nominal import gain of 4.5%. Looking ahead to 2007 the fate of the dollar is still a matter of speculation. US growth should pick up from its weak Q4 pace. Inventories should rebuild, thereby boosting imports. Overseas growth is expected to be ‘about the same to a bit stronger’. The real question is whether US exports can keep up the good work in 2007, or was 2006 some flash in the pan of good news? Imports will rise faster in 2007 than in 2006. That could make it impossible to make trade deficit reduction a reality in 2007 either. |
| Balances: | Q4-06 | Q3-06 | Q2-06 | 4Qtr-Avg | Prev4Qtr |
| Current Account | -195.8 | -229.4 | -217.7 | -214.2 | -197.9 |
| Trade | -197.9 | -218.9 | -210.9 | -209.0 | -195.7 |
| Services | 22.4 | 12.0 | 15.0 | 15.9 | 19.3 |
| Transfers | -20.2 | -22.5 | -21.9 | -21.0 | -21.5 |
| Growth Rates | Quarterly SAAR | 4-Qtr % for Yr Ended: | |||
| Merchandise | Q4-06 | Q3-06 | Q2-06 | Q4-06 | Q4-06 |
| Exports | 8.4% | 15.5% | 14.4% | 14.5% | 11.2% |
| Imports | -12.4% | 15.7% | 10.1% | 4.3% | 13.9% |
| Services | Q4-06 | Q3-06 | Q2-06 | Q4-06 | Q4-06 |
| Exports | 12.9% | 3.0% | 13.4% | 8.7% | 8.6% |
| Imports | 6.3% | 2.5% | 12.7% | 8.6% | 5.9% |
| memo: ($-Blns) | Q4-06 | Q3-06 | Q2-06 | 4Qtr-Avg | Prev4Qtr |
| Offical Gov't Securities Purchased | 78.0 | 78.0 | 21.6 | 60.9 | 39.1 |
Ex-petroleum import prices fell by 0.1% in February. Good news for core inflation trends. The 1Yr, 6-Mo, 3-mo progression of annualized inflation pressures also show that there is no pressure building. Yr/Yr non-petroleum import prices are up by 2.1%; looking over 3-mos annualized the gain is just 1.1%. Tame. Nonagricultural export prices show a bit more lift than that, partly aided by pressure from industrial supplies and materials, an export category that does contain some oil.
Looking more directly at prices that feed into consumer prices (look at the import figures), we see a bit of lift for consumer prices excluding vehicles and for foods and beverages. Vehicle import prices are under wraps. For the most part it does not look like there is an inflation impulse leaking in for the international sector.
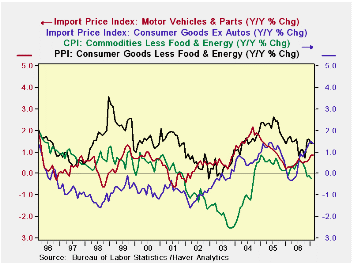
The chart on the left shows some key consumer goods price relationships. We plot import prices for vehicles and for consumer goods excluding vehicles Vs the CPI core for goods and the PPI consumer goods core. The PPI tends to show the highest gains; this index measures price for core consumer goods produced in the US. The Core CPI for goods consists of these products taken to the next level of distribution, adding consumer goods imports. That results in a core goods CPI index that has showed lower inflation than most other indexes since about August 2002. Nonvehicle consumer prices were, at one time, the slowest inflators on the block, but that changed in August of 2002. While the two international indexes do not show much in the way of inflation it is also true that vehicle imports and nonvehicle consumer goods imports sport higher inflation rates that the core CPI by itself and have been so for about one year . And the consumer core of the PPI is ‘ramping up’ albeit none of these yr/yr gains exceeds even 2% y/y yet. If it’s inflation in the making, it is still quite mild. The trends maybe less than reassuring but the degree of inflation that is in train remains quite MILD.
| Imports | Exports | ||||||
| SAAR | All | Petrol | Excl Petrol | SAAR | All | Agric | NonAgric |
| 3-MO | 1.8% | -11.2% | 1.1% | 3-MO | 7.0% | 22.9% | 5.9% |
| 6-MO | -7.4% | -38.8% | 1.5% | 6-MO | 2.9% | 22.3% | 1.4% |
| Yr/Yr | 1.3% | -5.5% | 2.1% | Yr/Yr | 4.7% | 16.9% | 3.7% |
| 2-Yrs | 4.1% | 18.0% | 1.9% | 2-Yrs | 3.7% | 10.6% | 3.2% |
| MO/MO | 0.2% | 2.0% | -0.1% | MO/MO | 0.7% | 2.3% | 0.6% |
by Robert A. Brusca March 14, 2007
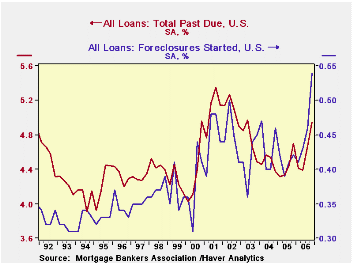
A notable catalyst for yesterday's stock market sell-off was the quarterly mortgage delinquency report from the Mortgage Bankers' Association (MBA). It showed that 4.95% (seasonally adjusted) of all loans surveyed by MBA were past due on December 31, an increase from 4.67% in September and the highest since September 2002. The foreclosure process was started on 0.54% of all loans, 0.08% more than during the previous quarter and a record high rate for a single quarter; at the end of December, 1.19% of loans were in foreclosure, up from 1.05% at end-September and 0.99% at the end of 2005. These rates are calculated on a total base of more than 42 million mortgage loans.
The MBA gives data on several types of mortgages: conventional prime, conventional subprime, FHA and VA. Each of these is further broken down by fixed and adjustable rate. Haver maintains these series in its specialized database MBAMTG and individual series are available on HaverSelect. The database includes seasonally adjusted data for the country as a whole and the four Census regions as well as not seasonally adjusted data for those areas plus the nine Census divisions, the 50 States, District of Columbia and Puerto Rico.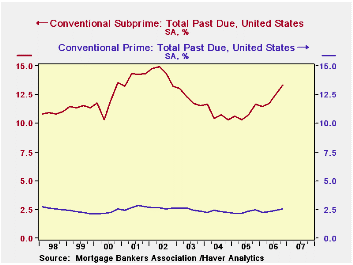
Delinquencies worsened for all major loan types. Conventional prime loans, which constitute 76.6% of the total market, had loan payments over due 30 days or more increase from 2.52% to 2.79% of the loans in that segment. Conventional subprime delinquencies rose from 12.95% to 14.27%. "Conventional" loans are those not insured by the federal government, such as FHA or VA. Conventional loans may be insured by private mortgage insurance or not insured at all. "Subprime" loans are those granted to borrowers with risky credit ratings or with excessively generous lending terms, such as loan-to-value ratios ("LTV") near 100%, whereas "prime" mortgages typically see LTVs below 80% and average or higher credit quality in the borrower.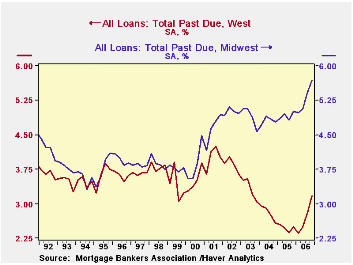
Delinquencies on FHA-backed loans affected 14.43% of those loans and foreclosures were initiated on 0.96%. VA-insured loans had a delinquency rate of 7.43% and a foreclosure rate of 0.36%.
There are very large differences in delinquency experiences among the regions of the country. The Northeast had 4.58% of its loans past due in December, near the national average. But the Midwest and the South were both at about 5.7% and the West at 3.18%. So credit quality varies considerably around the nation.
| Mortgage Delinquencies (SA, %) | Q4 2006 | Q3 2006 | Year Ago | 2006 | 2005 | 2004 | 2001 |
|---|---|---|---|---|---|---|---|
| Total Loans Past Due | 4.95 | 4.67 | 4.70 | 4.61 | 4.45 | 4.48 | 5.11 |
| Foreclosures Started | 0.54 | 0.46 | 0.42 | 1.86 | 1.63 | 1.73 | 1.80 |
| Conventional Prime Loan Delinquencies | 2.57 | 2.44 | 2.47 | 2.39 | 2.29 | 2.30 | 2.67 |
| Conventional Subprime Loan Delinquencies | 13.33 | 12.56 | 11.63 | 12.27 | 10.84 | 10.80 | 14.04 |

Robert Brusca
AuthorMore in Author Profile »Robert A. Brusca is Chief Economist of Fact and Opinion Economics, a consulting firm he founded in Manhattan. He has been an economist on Wall Street for over 25 years. He has visited central banking and large institutional clients in over 30 countries in his career as an economist. Mr. Brusca was a Divisional Research Chief at the Federal Reserve Bank of NY (Chief of the International Financial markets Division), a Fed Watcher at Irving Trust and Chief Economist at Nikko Securities International. He is widely quoted and appears in various media. Mr. Brusca holds an MA and Ph.D. in economics from Michigan State University and a BA in Economics from the University of Michigan. His research pursues his strong interests in non aligned policy economics as well as international economics. FAO Economics’ research targets investors to assist them in making better investment decisions in stocks, bonds and in a variety of international assets. The company does not manage money and has no conflicts in giving economic advice.
More Economy in Brief


