 Global| May 15 2009
U.S. CPI Unchanged in April; Year-to-Year Drop of 0.7% Is Largest Since 1955
by:Tom Moeller
|in:Economy in Brief
Summary
Weak pricing power continues to stem from a shortfall in U. S. demand. The Bureau of Labor Statistics reported that the Consumer Price Index was unchanged last month after a 0.1% slip during March. More indicative of the weakness in [...]
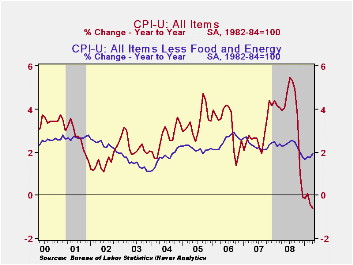
Weak pricing power continues to stem from a shortfall in U. S. demand. The Bureau of Labor Statistics reported that the Consumer Price Index was unchanged last month after a 0.1% slip during March. More indicative of the weakness in pricing power, the year-to-year change in consumer prices was -0.7%, the biggest since 1955. The April index was in accord with Consensus expectations for no change in the month.
The weakness in the recent CPI readings owes mostly to lower food and energy prices. In contrast, "core" pricing has picked up slightly. The CPI less food & energy rose 0.3% last month after three consecutive 0.2% increases. These gains lifted the twelve-month change to 1.9%, which was the firmest since January, and the growth rate here in 2009 has averaged 2.4% (AR). That four-month growth is up from a low of 0.5% as of December.
Lower energy prices again restrained overall pricing pressure
last month. The 2.4% decline in April reflected a 2.8% shortfall in
gasoline prices (-39.5% y/y) which added to a 4.0% March drop. Fuel oil
prices also continued downward with a 2.1% drop (-33.5% y/y). The
latest was the ninth consecutive monthly drop and it lowered prices by
one-third during the last twelve. Finally, prices for natural gas
& electricity have fallen in all but one of the last nine
months and year-to-year they are down 1.7%.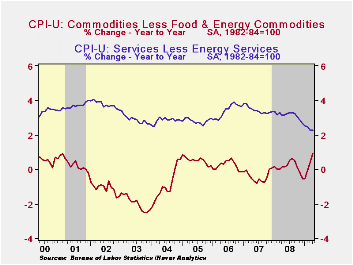
Lower food & beverage prices also continue to restrain overall inflationary pressure. Prices slipped for the third straight month and the y/y change of 3.3% was the weakest since early 2007, down from a peak of +6.1% last fall. Recent weakness has been led by lower dairy product prices (-5.1% y/y). Moreover, price gains for meats, poultry & fish (2.5% y/y) as well as fruits & vegetables (0.6% y/y) have eased sharply.
Bucking the disinflationary trend have been core
goods prices which rose 0.5% during April after three
consecutive 0.4% increases. Higher tobacco prices account continue to
account for some of that acceleration with a 28.8% y/y increase. But
there has been some modest firming of prices elsewhere. Prices for
household furnishings & operations have risen 1.8% y/y
following price deflation early last year. Apparel prices are up 0.9%
y/y after declines extending back to 1999. Prices of new & used
motor vehicles have risen during the last four months and the y/y
change of -1.7% compares to a rate of decline of 3.5% as of yearend
2008.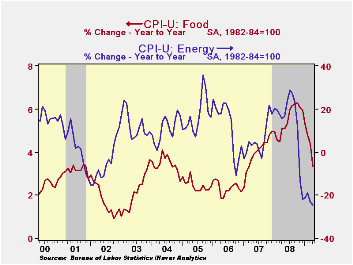
Gains in core services prices continue to moderate. The 0.2% uptick last month left the y/y change of 2.3% at its weakest since 1983. That moderation continues to owe mostly to weakness in the housing market which caused April shelter prices to rise just 0.2%, putting them up 1.6% y/y. That rise compares to gains above 4.0% two years ago. Owners equivalent rent of primary residence, a measure not equivalent to other house price measures, ticked up just 0.1% (2.1% y/y). The cost of travel did rise 0.5% during April but prices of lodging away from home are down 5.9% during the last year. Other service prices rose. The increase in medical care services prices picked up slightly to 0.4% (3.3% y/y) while education costs rose 0.4% and the y/y gain remained a firm 5.4%. Public transportation prices fell again. The 0.8% decline was the eighth drop in a row (-5.9% y/y).
The chained CPI, which adjusts for shifts in consumption patterns, gained 0.3% while year -to-year prices fell 1.1%. The increase in chained prices less food and energy eased to 0.2% in the month.
The consumer price data is available in Haver's USECON database while detailed figures can be found in the CPIDATA database.
Seeking Stability: What’s Next for Banking Regulation? from the Federal Reserve Bank of Dallas can be found here.
| Consumer Price Index (%) | April | March | Y/Y | 2008 | 2007 | 2006 |
|---|---|---|---|---|---|---|
| Total | 0.0 | -0.1 | -0.7 | 3.8 | 2.9 | 3.2 |
| Total less Food & Energy | 0.3 | 0.2 | 1.9 | 2.3 | 2.3 | 2.5 |
| Goods less Food & Energy | 0.5 | 0.4 | 0.9 | 0.1 | -0.4 | 0.2 |
| Services less Energy | 0.2 | 0.1 | 2.3 | 3.1 | 3.4 | 3.4 |
| Energy | -2.4 | -3.0 | -24.5 | 13.5 | 5.7 | 11.0 |
| Food & Beverages | -0.2 | -0.1 | 3.3 | 5.4 | 3.9 | 2.3 |
| Chained CPI: Total (NSA) | 0.3 | 0.2 | -1.1 | 3.3 | 2.5 | 2.9 |
| Total less Food & Energy | 0.2 | 0.4 | 1.4 | 2.0 | 2.0 | 2.2 |

Tom Moeller
AuthorMore in Author Profile »Prior to joining Haver Analytics in 2000, Mr. Moeller worked as the Economist at Chancellor Capital Management from 1985 to 1999. There, he developed comprehensive economic forecasts and interpreted economic data for equity and fixed income portfolio managers. Also at Chancellor, Mr. Moeller worked as an equity analyst and was responsible for researching and rating companies in the economically sensitive automobile and housing industries for investment in Chancellor’s equity portfolio. Prior to joining Chancellor, Mr. Moeller was an Economist at Citibank from 1979 to 1984. He also analyzed pricing behavior in the metals industry for the Council on Wage and Price Stability in Washington, D.C. In 1999, Mr. Moeller received the award for most accurate forecast from the Forecasters' Club of New York. From 1990 to 1992 he was President of the New York Association for Business Economists. Mr. Moeller earned an M.B.A. in Finance from Fordham University, where he graduated in 1987. He holds a Bachelor of Arts in Economics from George Washington University.
More Economy in Brief


