 Global| Oct 17 2007
U.S. CPI Gain Quickest Since May, Core Rate 0f 0.2% Stable
by:Tom Moeller
|in:Economy in Brief
Summary
The consumer price index (CPI-U) rose 0.3% last month and that was the quickest since May. At 2.8%, the y/y rise also picked up and was the fastest since March. The September increase was slightly ahead of expectations for a 0.2% [...]
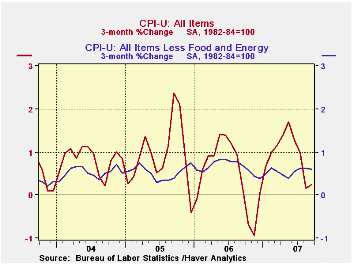
The consumer price index (CPI-U) rose 0.3% last month and that was the quickest since May. At 2.8%, the y/y rise also picked up and was the fastest since March. The September increase was slightly ahead of expectations for a 0.2% gain.
Food & beverage prices continued with a pattern of steadily increasing rates of change with a 0.5% (4.4% y/y) rise. That y/y increase is double the rate of last December. Prices for meats, poultry & fish firmed by 0.5% (5.5% y/y) and prices of dairy product prices jumped another 1.0% with the y/y gain a whopping 13.2%.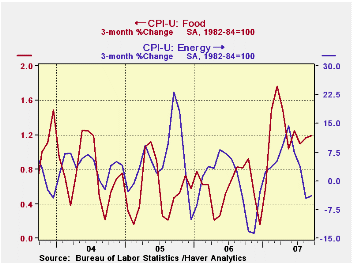
Energy prices were somewhat tame last month, rising just 0.3%, but gasoline prices (+8.7% y/y y/y) rose slightly for the first month in the last four. Fuel oil prices jumped 1.0% (6.5% y/y) but natural gas & electricity prices rose 0.1% (1.4% y/y) after five consecutive months of decline.
Core consumer price inflation held stable at 0.2% for the fifth month in the last six and the y/y increase held stable with August at 2.1%.
Core goods prices fell just slightly as they did in August. Apparel prices again reversed direction and rose 0.3% (-1.7% y/y) after a 0.5% August decline and a 0.4% July increase. New & Used motor vehicle prices were under pressure and fell 0.2% (-1.3% y/y) while prices of household furnishings & operation fell for the third straight month by 0.2% (-0.7% y/y).Tobacco prices again provided much of the lift to goods price inflation with an accelerated 0.8% (7.5% y/y) rise.
Minutes of the Federal Reserve Board Discount Rate Meetings, August 16 through September 18, 2007 are available here.
| Consumer Price Index | Sept | Aug | July | Y/Y | 2006 | 2005 | 2004 |
|---|---|---|---|---|---|---|---|
| Total | 0.3% | -0.1% | 0.1% | 2.8% | 3.2% | 3.4% | 2.7% |
| Total less Food & Energy | 0.2% | 0.2% | 0.2% | 2.2% | 2.5% | 2.2% | 1.8% |
| Goods less Food & Energy | -0.0% | -0.0% | 0.1% | -0.8% | 0.2% | 0.5% | -0.9% |
| Services less Energy | 0.3% | 0.2% | 0.3% | 3.3% | 3.4% | 2.8% | 2.8% |
| Energy | 0.3% | -3.2% | -1.0% | 5.4% | 11.1% | 16.9% | 10.8% |
| Food & Beverages | 0.5% | 0.4% | 0.3% | 4.4% | 2.3% | 2.4% | 3.4% |
| Chained CPI: Total (NSA) | 0.3% | -0.1% | -0.1% | 2.3% | 2.8% | 2.9% | 2.5% |
| Total less Food & Energy | 0.3% | 0.2% | 0.0% | 1.7% | 2.3% | 1.9% | 1.7% |

Tom Moeller
AuthorMore in Author Profile »Prior to joining Haver Analytics in 2000, Mr. Moeller worked as the Economist at Chancellor Capital Management from 1985 to 1999. There, he developed comprehensive economic forecasts and interpreted economic data for equity and fixed income portfolio managers. Also at Chancellor, Mr. Moeller worked as an equity analyst and was responsible for researching and rating companies in the economically sensitive automobile and housing industries for investment in Chancellor’s equity portfolio. Prior to joining Chancellor, Mr. Moeller was an Economist at Citibank from 1979 to 1984. He also analyzed pricing behavior in the metals industry for the Council on Wage and Price Stability in Washington, D.C. In 1999, Mr. Moeller received the award for most accurate forecast from the Forecasters' Club of New York. From 1990 to 1992 he was President of the New York Association for Business Economists. Mr. Moeller earned an M.B.A. in Finance from Fordham University, where he graduated in 1987. He holds a Bachelor of Arts in Economics from George Washington University.
More Economy in Brief


