 Global| May 14 2008
U.S. Consumer Price Index Under Control in April
by:Tom Moeller
|in:Economy in Brief
Summary
The consumer price index (CPI-U) rose 0.2% last month, down from the 0.3% March increase and less than the 0.3% rise that was generally expected. Year-to-year, prices rose 3.9% which was off the earlier highs of 4.4%. Less food & [...]
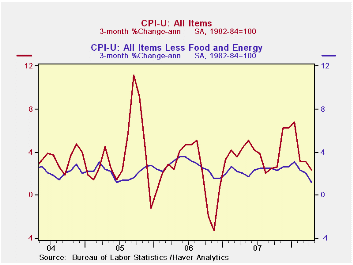
The consumer price index (CPI-U) rose 0.2% last month, down from the 0.3% March increase and less than the 0.3% rise that was generally expected. Year-to-year, prices rose 3.9% which was off the earlier highs of 4.4%.
Less food & energy, consumer prices also were under control last month and posted just a 0.1% uptick. That was half the Consensus forecast for a 0.2% gain. The year-to-year rise of 2.3% was equal to last year's full year gain and down from the 2.5% increase during 2006.
Food & beverage prices provided lift to last month's gain in the CPI with a 0.9% increase. The year-to-year increase of 5.0% was the strongest since 1990. Prices for meats poultry & fish broke out of a several month slumber and rose 0.9% (3.7% y/y). Showing real strength, however, were prices for cereal & bakery products which increased another 1.4%. The y/y rise in these prices of 8.9% was the strongest since 1989. Dairy product prices also were quite firm and rose 0.7%. They surged 11.8% year-to-year.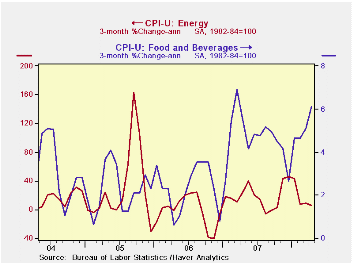
Energy prices were under control last month and fell slightly. The weakness was due to a surprising 2.0% (+20.7% y/y) decline in seasonally adjusted gasoline prices. (Not seasonally adjusted gas prices rose 5.6% m/m in April and they are up another 6.1% so far in May.) Conversely, fuel oil prices last month surged 3.6% (42.8% y/y) while natural gas & electricity prices also were strong. They posted a 2.5% increase (6.7% y/y).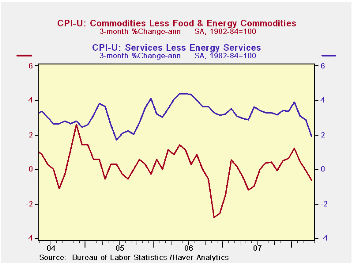
Core goods prices were unchanged following two consecutive months of 0.1% decline. Lower prices for new & used motor vehicles led the weakness with a 0.2% decline (-0.3% y/y). Prices for household furnishings & operations also fell by 0.1% (-0.1% y/y) after their brief 0.5% March increase. Apparel prices showed the only one month strength with a 0.5% (-0.6% y/y) increase that was the strongest rise since last November.
Core services prices also were under control and ticked up just 0.1%. Shelter prices, which constitute 33% of the total CPI, for the second month rose just 0.1% (2.6% y/y). Owners equivalent rent of primary residence, a measure not equivalent to other house price measures, rose 0.2% (2.6% y/y) and rents rose 0.3% (3.6% y/y). The downside to shelter costs was provided by lodging away from home where prices fell 1.9% (+1.1% y/y). Medical care services prices increased 0.3% (4.7% y/y) and tuition costs surged 0.6% (5.6% y/y). Prices for public transportation fell 0.4% (7.3% y/y) after the 2.5% March rise.
Are Inflation Targets Good Inflation Forecasts? from the Federal Reserve Bank of Chicago is available here.
Has the Behavior of Inflation and Long-Term Inflation Expectations Changed? from the Federal Reserve Bank of Kansas City can be found here.
| Consumer Price Index (%) | April | March | February | April Y/Y | 2007 | 2006 | 2005 |
|---|---|---|---|---|---|---|---|
| Total | 0.2 | 0.3 | 0.0 | 3.9 | 2.9 | 3.2 | 3.4 |
| Total less Food & Energy | 0.1 | 0.2 | 0.0 | 2.3 | 2.3 | 2.5 | 2.2 |
| Goods less Food & Energy | 0.0 | -0.1 | -0.1 | 0.1 | -0.4 | 0.2 | 0.5 |
| Services less Energy | 0.1 | 0.2 | 0.1 | 3.1 | 3.4 | 3.4 | 2.8 |
| Energy | -0.0 | 1.9 | -0.5 | 15.5 | 5.6 | 11.0 | 17.0 |
| Food & Beverages | 0.9 | 0.2 | 0.4 | 5.0 | 4.0 | 2.3 | 2.5 |
| Chained CPI: Total (NSA) | 0.5 | 0.8 | 0.3 | 3.5 | 2.5 | 2.9 | 2.9 |
| Total less Food & Energy | 0.1 | 0.5 | 0.3 | 1.9 | 2.0 | 2.2 | 1.9 |

Tom Moeller
AuthorMore in Author Profile »Prior to joining Haver Analytics in 2000, Mr. Moeller worked as the Economist at Chancellor Capital Management from 1985 to 1999. There, he developed comprehensive economic forecasts and interpreted economic data for equity and fixed income portfolio managers. Also at Chancellor, Mr. Moeller worked as an equity analyst and was responsible for researching and rating companies in the economically sensitive automobile and housing industries for investment in Chancellor’s equity portfolio. Prior to joining Chancellor, Mr. Moeller was an Economist at Citibank from 1979 to 1984. He also analyzed pricing behavior in the metals industry for the Council on Wage and Price Stability in Washington, D.C. In 1999, Mr. Moeller received the award for most accurate forecast from the Forecasters' Club of New York. From 1990 to 1992 he was President of the New York Association for Business Economists. Mr. Moeller earned an M.B.A. in Finance from Fordham University, where he graduated in 1987. He holds a Bachelor of Arts in Economics from George Washington University.
More Economy in Brief


