 Global| Nov 09 2009
U.S. Consumer Credit OutstandingContinues To Fall
by:Tom Moeller
|in:Economy in Brief
Summary
Consumers continue to deleverage as the prospects for employment remain uncertain. The Federal Reserve reported late Friday that consumer credit outstanding fell for the eighth consecutive month during September. It also was the [...]
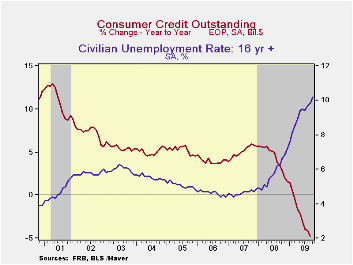 Consumers
continue to deleverage as the prospects for employment remain
uncertain. The Federal Reserve reported late Friday that consumer
credit outstanding fell for the eighth consecutive month during
September. It also was the twelfth monthly decline since summer, 2008.
The $14.9B drop from August followed declines during the prior two
months which were revised shallower, but the y/y change amounted to a
record 4.8% drop. With these declines, consumers have reduced
credit outstanding as a percentage of disposable income to 22.6% from
its 2005 high of 24.4%. This compares to the low near 16% in the
early-1990s.
Consumers
continue to deleverage as the prospects for employment remain
uncertain. The Federal Reserve reported late Friday that consumer
credit outstanding fell for the eighth consecutive month during
September. It also was the twelfth monthly decline since summer, 2008.
The $14.9B drop from August followed declines during the prior two
months which were revised shallower, but the y/y change amounted to a
record 4.8% drop. With these declines, consumers have reduced
credit outstanding as a percentage of disposable income to 22.6% from
its 2005 high of 24.4%. This compares to the low near 16% in the
early-1990s.
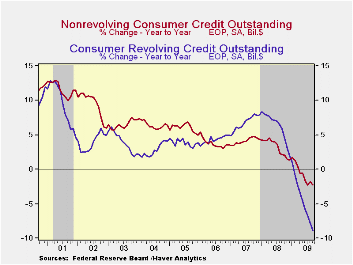 Usage of
non-revolving credit (autos &
other consumer durables), which accounts for nearly two-thirds of the
total, fell $4.9B after a slight August increase. The 2.3% y/y decline
was a record. Consumers continued also to cut back on revolving credit
usage. During September it fell a near-record $9.9B for the twelfth
consecutive monthly drop. Year-to-year the 8.8% decline is by far the
record as consumers continued to shy away from liberal spending.
Usage of
non-revolving credit (autos &
other consumer durables), which accounts for nearly two-thirds of the
total, fell $4.9B after a slight August increase. The 2.3% y/y decline
was a record. Consumers continued also to cut back on revolving credit
usage. During September it fell a near-record $9.9B for the twelfth
consecutive monthly drop. Year-to-year the 8.8% decline is by far the
record as consumers continued to shy away from liberal spending.
Finance companies (-12.3% y/y), savings institutions (-9.8%
y/y),
nonfinancial businesses (-6.4%) and commercial banks (-1.5% y/y have
seen the largest pullbacks in credit extension while credit unions
continue to see positive growth (1.9% y/y). 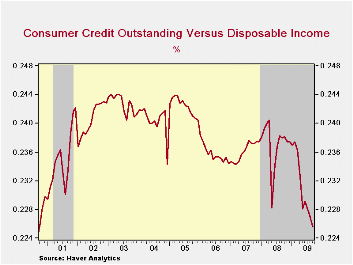 The Federal government and
Sallie Mae also continued to lend during September and raised credit
outstanding by 23.9% y/y which was the strongest growth rate since
early-2001.· These figures are the major input to the Fed's quarterly
Flow of Funds accounts for the household sector.
The Federal government and
Sallie Mae also continued to lend during September and raised credit
outstanding by 23.9% y/y which was the strongest growth rate since
early-2001.· These figures are the major input to the Fed's quarterly
Flow of Funds accounts for the household sector.
Credit data are available in Haver's USECON database. The Flow of Funds data are in Haver's FFUNDS database.
Monetary Policy Stance: The View From Consumption Spending from the Federal Reserve Bank of St. Louis is available here
| Consumer Credit Outstanding (m/m Chg, SAAR) | September | August | Y/Y | 2008 | 2007 | 2006 |
|---|---|---|---|---|---|---|
| Total | $-14.8B | $-9.9B | -4.8% | 1.6% | 5.6% | 4.1% |
| Revolving | $-9.9B | $-10.1B | -8.8% | 1.9% | 7.8% | 5.0% |
| Non-revolving | $-4.9B | $0.2B | -2.3% | 1.4% | 4.4% | 3.6% |
Improved Business Sentiment In France,Industrial Production Increases In Germany, Romania And Slovakia Falters In Turkey
by Louise Curley November 09, 2009
 In the news
today are reports of French business sentiment and industrial
production in Germany, Romania, Slovakia and Turkey.
In the news
today are reports of French business sentiment and industrial
production in Germany, Romania, Slovakia and Turkey.
French business
sentiment continues to improve. From the low point
of 66.96 reached in December of last year, the Bank of France's
Business Sentiment Indicator has risen in each subsequent month and in
October was up to 94.80, just 5.20 points below 100, its long term
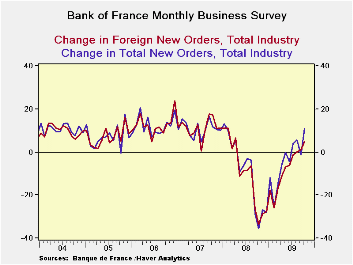
average. An important factor in the improvement in sentiment
has been the increase in new orders--the total and foreign.
The first chart shows the percent balances between those experiencing
an increase in total and foreign new orders over those experiencing a
decline. 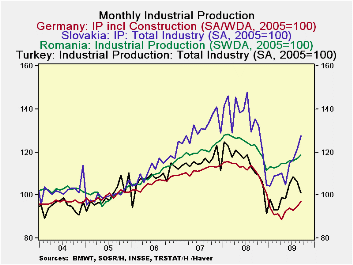 In October, the excess of those experiencing an
increase in foreign new orders over those experiencing a decline was
4.85%, while the excess for total orders was 10.9% as shown in the
first chart.
In October, the excess of those experiencing an
increase in foreign new orders over those experiencing a decline was
4.85%, while the excess for total orders was 10.9% as shown in the
first chart.
The most
important report on industrial production
released today is that for Germany and it is encouraging.
Industrial production in Germany is up for the second month. While
developments in Germany, as the largest economy in Europe, overshadow
those in the smaller and less developed economies of Eastern Europe and
the Middle East, it is encouraging to see that the representatives of
the latter groups in today's news are making strong percentage gains in
industrial production. 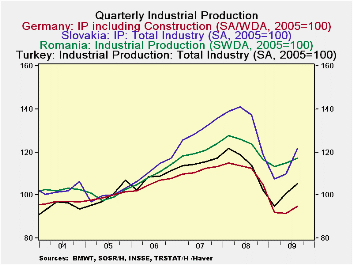 The month to month changes in
production in the emerging countries tend to be volatile even on a
seasonally adjusted basis. The picture becomes
clearer when we aggregate the date on a quarterly basis as can be seen
in a comparison of the second and third
charts.
The month to month changes in
production in the emerging countries tend to be volatile even on a
seasonally adjusted basis. The picture becomes
clearer when we aggregate the date on a quarterly basis as can be seen
in a comparison of the second and third
charts.
| Oct 09 | Sep 09 | Oct 08 | M/M CHG | Y/Y CHG | 2008 | 2007 | 2006 | |
|---|---|---|---|---|---|---|---|---|
| French Business Sentiment Indicator (LTA=100) | 94.8 | 90.2 | 78.0 | 2.1 | 26.6 | 90.6 | 107 | 105.9 |
| Total New Orders % balance | 10.90 | -1.54 | -35.51 | 12.44 | 46.41 | -9.18 | 10.84 | 12.28 |
| Foreign New Order % balance | 4.78 | 1.21 | -33.48 | 3.57 | 38.26 | -10.04 | 11.15 | 12.59 |
| Industrial Production (2005=100) | Sep 09 | Aug 09 | Sep 08 | M/M CHG | Y/Y CHG | 2008 | 2007 | 2006 |
| Germany | 97.0 | -4.6 | 111.5 | 2.75 | -12.83 | 111.5 | 111.6 | 105.4 |
| Romania | 118.4 | 116.8 | 123.3 | 1.37 | -3.97 | 123.5 | 120.6 | 109.6 |
| Slovakia | 127.7 | 121.1 | 135.3 | 5.15 | -5.62 | 134.1 | 130.4 | 112.1 |
| Turkey | 101.2 | 106.3 | 110.3 | -4.80 | -8.25 | 114.3 | 115.3 | 107.8 |

Tom Moeller
AuthorMore in Author Profile »Prior to joining Haver Analytics in 2000, Mr. Moeller worked as the Economist at Chancellor Capital Management from 1985 to 1999. There, he developed comprehensive economic forecasts and interpreted economic data for equity and fixed income portfolio managers. Also at Chancellor, Mr. Moeller worked as an equity analyst and was responsible for researching and rating companies in the economically sensitive automobile and housing industries for investment in Chancellor’s equity portfolio. Prior to joining Chancellor, Mr. Moeller was an Economist at Citibank from 1979 to 1984. He also analyzed pricing behavior in the metals industry for the Council on Wage and Price Stability in Washington, D.C. In 1999, Mr. Moeller received the award for most accurate forecast from the Forecasters' Club of New York. From 1990 to 1992 he was President of the New York Association for Business Economists. Mr. Moeller earned an M.B.A. in Finance from Fordham University, where he graduated in 1987. He holds a Bachelor of Arts in Economics from George Washington University.
More Economy in Brief


