 Global| Apr 25 2017
U.S. Consumer Confidence Backpedals
by:Tom Moeller
|in:Economy in Brief
Summary
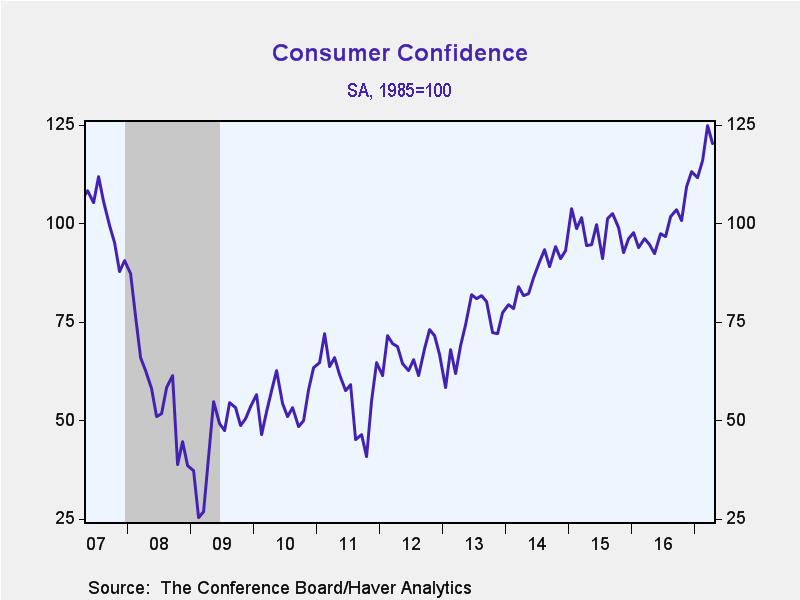
The Conference Board Consumer Confidence Index fell 3.7% during April (+27.0% y/y) to 120.3 following a little-revised 7.6% March gain. Despite the decline, the index remained near the highest level since December 2000. The Action [...]
The Conference Board Consumer Confidence Index fell 3.7% during April (+27.0% y/y) to 120.3 following a little-revised 7.6% March gain. Despite the decline, the index remained near the highest level since December 2000. The Action Economics Forecast Survey looked for a decline to 123.0. During the past thirty years, there has been a 70% correlation between the level of consumer confidence and the y/y change in real PCE.
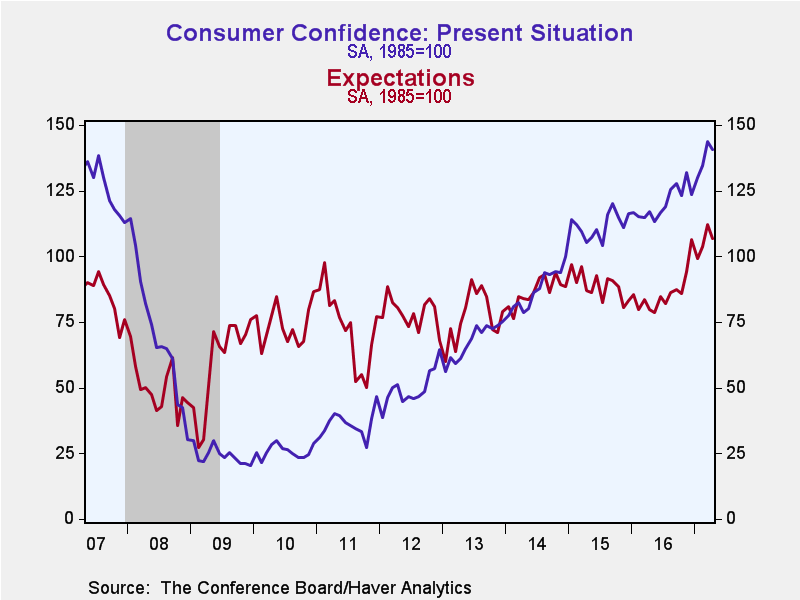
The decline in confidence reflected a 5.0% fall (+33.9% y/y) in the expectations reading to 106.7. The present situation index eased 2.3% (+20.1% y/y) to 140.6.
The percentage of respondents indicating that business conditions are "good" slipped to 30.2%, while those saying business conditions are "bad" ticked up to 13.8%. Respondents stating that jobs are "plentiful" eased to 30.8%, still near the highest percentage since 2001, while those claiming jobs are "hard to get" held fairly steady at 19.1%. These changes in views on labor market conditions led to an easier labor market differential (a reliable indicator of the unemployment rate) of 11.7 percentage points, but that remained near the 2001 high.
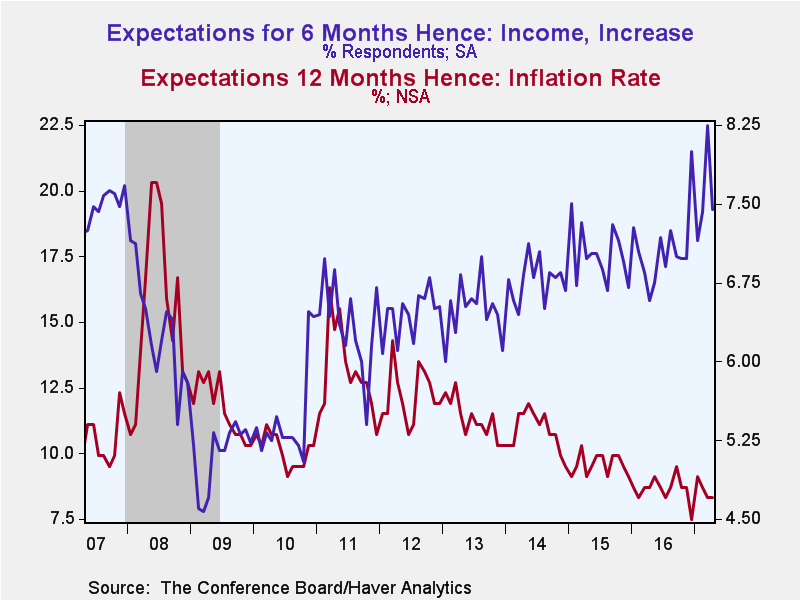
The percentage expecting business conditions to improve over the next six months fell back from its March high to 24.8%. For labor markets, the percentage expecting more jobs in the months ahead slipped to 23.0%, still a cycle high. The percentage of consumers expecting their incomes to strengthen eased to 19.3%, and reversed the March rise.
The expected rate of inflation in twelve months held steady at 4.7%. The percentage expecting higher interest rates over the next twelve months eased to 71.3%.
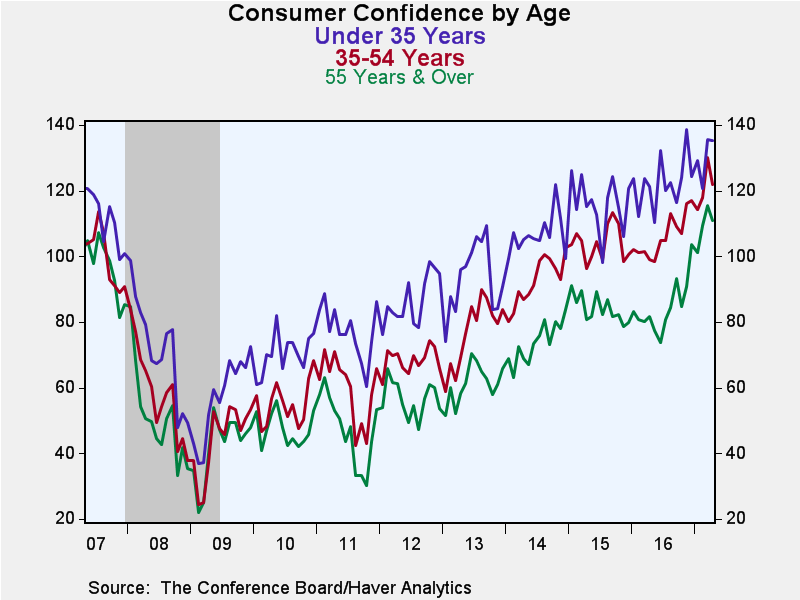
Confidence amongst individuals over age 55 fell moderately. Confidence amongst individuals aged 35-to-54 also declined, but confidence amongst respondents under age 35 remained firm.
The Consumer Confidence data is available in Haver's CBDB database. The total indexes appear in USECON, and the market expectations are in AS1REPNA
| Conference Board (SA, 1985=100) | Apr | Mar | Feb | Y/Y % | 2016 | 2015 | 2014 |
|---|---|---|---|---|---|---|---|
| Consumer Confidence Index | 120.3 | 124.9 | 116.1 | 27.0 | 99.8 | 98.0 | 86.9 |
| Present Situation | 140.6 | 143.9 | 134.4 | 20.1 | 120.6 | 111.7 | 87.4 |
| Expectations | 106.7 | 112.3 | 103.9 | 33.9 | 86.1 | 88.8 | 86.6 |
| Consumer Confidence By Age Group | |||||||
| Under 35 Years | 135.4 | 135.7 | 120.6 | 11.6 | 122.4 | 116.0 | 106.6 |
| Aged 35-54 Years | 122.0 | 130.0 | 118.0 | 23.1 | 106.2 | 103.9 | 92.4 |
| Over 55 Years | 111.0 | 115.4 | 109.5 | 35.7 | 84.6 | 84.1 | 73.8 |
Tom Moeller
AuthorMore in Author Profile »Prior to joining Haver Analytics in 2000, Mr. Moeller worked as the Economist at Chancellor Capital Management from 1985 to 1999. There, he developed comprehensive economic forecasts and interpreted economic data for equity and fixed income portfolio managers. Also at Chancellor, Mr. Moeller worked as an equity analyst and was responsible for researching and rating companies in the economically sensitive automobile and housing industries for investment in Chancellor’s equity portfolio. Prior to joining Chancellor, Mr. Moeller was an Economist at Citibank from 1979 to 1984. He also analyzed pricing behavior in the metals industry for the Council on Wage and Price Stability in Washington, D.C. In 1999, Mr. Moeller received the award for most accurate forecast from the Forecasters' Club of New York. From 1990 to 1992 he was President of the New York Association for Business Economists. Mr. Moeller earned an M.B.A. in Finance from Fordham University, where he graduated in 1987. He holds a Bachelor of Arts in Economics from George Washington University.
More Economy in Brief
 Global| Feb 05 2026
Charts of the Week: Balanced Policy, Resilient Data and AI Narratives
by:Andrew Cates


