 Global| Jul 13 2005
Trade Expands at Individual Ports, Shown in Extensive Data Offerings in PORTS Database
Summary
In addition to the usual national trade data that Haver carries in the USECON and USINT databases, regional databases give information on foreign trade shipments into and out of various locations around the country. Some time ago, we [...]
In addition to the usual national trade data that Haver carries in the USECON and USINT databases, regional databases give information on foreign trade shipments into and out of various locations around the country. Some time ago, we described EXPORTSR, an annual database, and its associated monthly counterparts. These contain exports from individual states to specific countries by broad product category. We also have the PORTS database, showing the value and weight of imports and exports through various ports, by both sea and air transportation. This database covers 46 customs districts encompassing 443 ports. All of these huge quantities of data are produced by the Census Bureau and are released on the same day as the aggregate trade data.
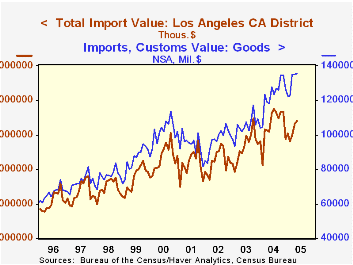
The table below shows imports arriving at a sample of Customs Districts. Los Angeles is the largest and includes the ports of Los Angeles and Long Beach as well as Los Angeles International Airport (LAX), among others. Its merchandise receipts in May were $21.6 billion, up 6.1% from a year ago. [Exports outbound from there were $6.7 billion, up 6.7%.]
In the New York area, imports were almost exactly $16.0 billion in May, up 16.5% from May 2004. An interesting aspect of New York trade is the huge value of imports that come by air through JFK Airport, as seen below, $6.5 billion in May and an average of $6.1 billion for all of last year.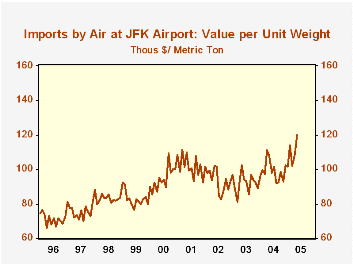
At the same time, the volume of these flows in metric tons is vastly different. A rule of thumb in shipping is that items with high value per unit weight are good for air freight, while the opposite is true for sea-going trade. A quick comparison illustrates this easily. Goods coming into JFK in May weighed 53,740 metric tons, yielding a unit value of $120,077. Goods coming by ship into Port Newark were worth $7.399 billion, but they weighed 4.5 million metric tons (MT), a value per MT of just $1,638.
| Customs District: Customs Value, NSA, Million $ | May 2005 | Apr 2005 | May 2004 | Monthly Averages|||
|---|---|---|---|---|---|---|
| 2004 | 2003 | 2002 | ||||
| Total Imports | 135,542 | 135,257 | 118,271 | 122,475 | 104,760 | 96,780 |
| New York total | 16,000 | 15,331 | 13,736 | 14,800 | 13,070 | 12,161 |
| Air at JFK | 6,453 | 6,220 | 5,563 | 6,050 | 5,442 | 5,723 |
| Los Angeles | 21,627 | 21,261 | 20,389 | 21,005 | 18,609 | 16,984 |
| Seattle | 6,091 | 6,167 | 4,825 | 5,408 | 4,558 | 4,378 |
| Chicago Total | 4,570 | 4,665 | 3,821 | 4,473 | 3,750 | 3,245 |
| Chicago Air | 3,423 | 3,602 | 2,798 | 3,349 | 2,813 | 2,433 |
| New Orleans | 7,157 | 7,864 | 5,242 | 5,729 | 4,384 | 3,874 |
Carol Stone, CBE
AuthorMore in Author Profile »Carol Stone, CBE came to Haver Analytics in 2003 following more than 35 years as a financial market economist at major Wall Street financial institutions, most especially Merrill Lynch and Nomura Securities. She had broad experience in analysis and forecasting of flow-of-funds accounts, the federal budget and Federal Reserve operations. At Nomura Securities, among other duties, she developed various indicator forecasting tools and edited a daily global publication produced in London and New York for readers in Tokyo. At Haver Analytics, Carol was a member of the Research Department, aiding database managers with research and documentation efforts, as well as posting commentary on select economic reports. In addition, she conducted Ways-of-the-World, a blog on economic issues for an Episcopal-Church-affiliated website, The Geranium Farm. During her career, Carol served as an officer of the Money Marketeers and the Downtown Economists Club. She had a PhD from NYU's Stern School of Business. She lived in Brooklyn, New York, and had a weekend home on Long Island.
More Economy in Brief


