 Global| Nov 18 2005
State Coincident Indexes Highlight Regional Differences in Economic Activity
Summary
As readers are no doubt aware, among its many offerings, Haver Analytics carries a large number of regional databases. These cover such concepts as gross state product, county personal income, rental vacancy rates for all 50 states [...]
As readers are no doubt aware, among its many offerings, Haver Analytics carries a large number of regional databases. These cover such concepts as gross state product, county personal income, rental vacancy rates for all 50 states and 75 metropolitan areas. A client query the other day called our attention to a very simple set of data we have had in the general REGIONAL database for the last couple of years, the Philadelphia Fed's "Coincident Economic Activity Indexes" for all 50 states.
These indexes are simple, handy, and available promptly compared with much regional information. Data on all 50 states were published on November 1 for September. October data will be out December 1. History goes back to 1979. They are calculated from four indicators:nonfarm payrolls, the unemployment rate, the workweek in manufacturing and real wage and salary income. All four of these are available in comparable form for all 50 states. Based in a Stock & Watson framework, log changes are used in compiling each month's figure, and the index trend is tied to gross state product, an annual figure. A full and authoritative description of the calculation appears in a Philadelphia Fed working paper, "Consistent Indexes for the 50 States" by Theodore Crone, circulated in June 2003. The paper can be accessed here .
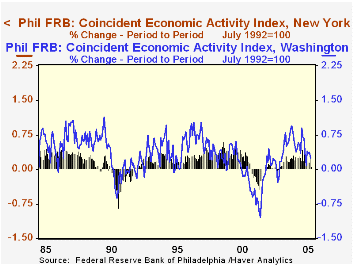
We know intuitively that regional and local economies behave differently and these indexes show that in a quick summary number. In the table below, we show five arbitrarily selected states, plus two national coincident indexes calculated by private institutions. These five state index levels through August vary from 124.2 to 158.0 on a base of July 1992=100, indicating widely varying degrees of overall vitality. Four of these states and most of the rest had gains through early summer. We see, though, that Louisiana had already had two down months in July and August. Its index then fell 14.5% in September, when Katrina hit. The index for Mississippi was off 4.0% that month. A few of the varying patterns among states are shown in our accompanying graphs. In the first graph, the tech boom and bust is evident in the comparison of Washington State with New York. The second graph shows the impact of Hurricane Katrina. Notice that states even right next to each other can show differing paths of economic activity; for example, North and South Dakota vary with ups and downs in many months, and South Dakota's index stood at 154.7 in September, while North Dakota's was only 133.1.
The Philadelphia Fed explains that it has compiled and maintains these indexes to facilitate research and analysis of just such cross-state and state/national economic interactions. According to the conclusion of the paper cited above, "Possible issues include the study of state business cycles, the effect of national economic forces on individual states, and the effect of the state’s overall economic activity on state fiscal conditions, poverty, or in-migration."
| Index Levels/% Changes | Sep 2005 | Aug 2005 | Jul 2005 | Sep 2004 | 2004 | 2003 | 2002 |
|---|---|---|---|---|---|---|---|
| Conference Board Coincident Indicators (rebased to 1992=100) | 136.0 | 136.1 | 136.2 | 132.8 | 132.5 | 129.0 | 128.5 |
| -0.1 | -0.1 | 0.2 | 2.4 | 2.7 | 0.4 | -0.6 | |
| ECRI Coincident Index (1992=100) | 146.9 | 147.2 | 147.2 | 142.8 | 142.2 | 137.2 | 135.7 |
| -0.2 | 0.0 | 0.3 | 2.9 | 3.7 | 1.1 | -0.2 | |
| Philly Fed State Indexes (July 1992=100) | |||||||
| New York | 140.0 | 139.9 | 139.5 | 136.1 | 135.2 | 132.0 | 131.0 |
| 0.1 | 0.3 | 0.2 | 2.9 | 2.4 | 0.7 | -0.9 | |
| California | 154.5 | 154.0 | 153.5 | 149.2 | 148.0 | 144.0 | 142.8 |
| 0.4 | 0.3 | 0.4 | 3.5 | 2.8 | 0.8 | -0.1 | |
| Texas | 158.2 | 158.0 | 157.7 | 154.1 | 153.2 | 149.6 | 149.3 |
| 0.1 | 0.2 | 0.2 | 2.7 | 2.4 | 0.2 | -0.8 | |
| Iowa | 143.0 | 142.6 | 142.2 | 138.3 | 137.7 | 134.5 | 133.9 |
| 0.2 | 0.3 | 0.3 | 3.3 | 2.4 | 0.4 | -0.8 | |
| Louisiana | 106.2 | 124.2 | 125.3 | 124.5 | 124.5 | 123.3 | 122.6 |
| -14.5 | -0.6 | -0.4 | -14.7 | 1.0 | 0.5 | -1.0 | |
Carol Stone, CBE
AuthorMore in Author Profile »Carol Stone, CBE came to Haver Analytics in 2003 following more than 35 years as a financial market economist at major Wall Street financial institutions, most especially Merrill Lynch and Nomura Securities. She had broad experience in analysis and forecasting of flow-of-funds accounts, the federal budget and Federal Reserve operations. At Nomura Securities, among other duties, she developed various indicator forecasting tools and edited a daily global publication produced in London and New York for readers in Tokyo. At Haver Analytics, Carol was a member of the Research Department, aiding database managers with research and documentation efforts, as well as posting commentary on select economic reports. In addition, she conducted Ways-of-the-World, a blog on economic issues for an Episcopal-Church-affiliated website, The Geranium Farm. During her career, Carol served as an officer of the Money Marketeers and the Downtown Economists Club. She had a PhD from NYU's Stern School of Business. She lived in Brooklyn, New York, and had a weekend home on Long Island.
More Economy in Brief


