 Global| Oct 10 2006
Small Business Optimism Recovered, Pricing Pressures Eased
by:Tom Moeller
|in:Economy in Brief
Summary
In September, small business optimism more than recovered the prior month's decline. A 3.6% increase lifted the index to the highest level since April, according to the National Federation of Independent Business (NFIB). During the [...]
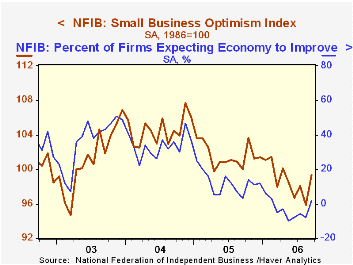
In September, small business optimism more than recovered the prior month's decline. A 3.6% increase lifted the index to the highest level since April, according to the National Federation of Independent Business (NFIB).
During the last ten years there has been a 70% correlation between the level of the NFIB index and the two quarter change in real GDP.
Respondents expecting the economy to improve rose to the best level since February and the percentage planning to increase employment held at the highest level since February.
The percent of firms currently with one or more job openings held at 25%, about where it's been since May. During the last ten years there has been a 72% correlation between the NFIB percentage and the y/y change in nonfarm payrolls.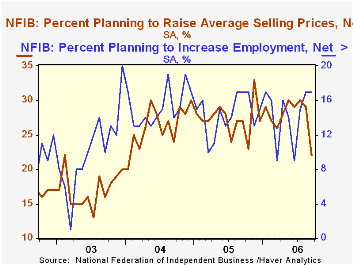
The percent planning to raise capital expenditures rose back to 30% recovering most of the prior month's decline..The percentage of firms planning to raise average selling prices fell sharply to 22%, the lowest level since early 2004. The percentage of firms actually raising prices also fell to 20%, its lowest level since March. During the last ten years there has been a 60% correlation between the change in the producer price index and the level of the NFIB price index.
About 24 million businesses exist in the United States. Small business creates 80% of all new jobs in America.
Prospects for the U.S. Economy, yesterday's speech by Janet L. Yellen, President and CEO of the Federal Reserve Bank of San Francisco can be found here.
| Nat'l Federation of Independent Business | September | August | Y/Y | 2005 | 2004 | 2003 |
|---|---|---|---|---|---|---|
| Small Business Optimism Index (1986=100) | 99.4 | 95.9 | -0.6% | 101.6 | 104.6 | 101.3 |
by Louise Curley October 10, 2006
Kazakhstan, strategic for its oil and natural gas reserves, has lately been in the news with the visit of President Nursultan Nazarbayev to the White House and, more recently, with the attractiveness of its high yielding investment grade bonds. Haver is building a data base for Kazakhstan based on country sources. These data can be found in the Haver Data Base EMERGECW. Data are also available in the IFS data base but, in some cases, the country sourced data have more detail and are more current. For example, currently, the country sourced data provides GDP on a seasonally unadjusted basis for the first and second quarters of 2006, while the IFS data base has data only through the fourth quarter of 2005.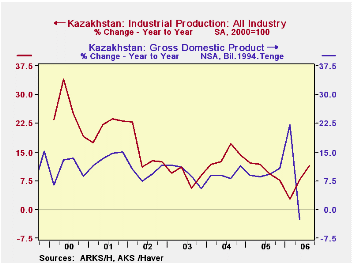
Kazakhstan is a former Soviet Republic and is located in central Asia, bordering China, Russia, Kyrgyzstan, Turkmenistan and Uzbekistan. It is about the size of Western Europe and has a population of about 15 million people. Its 2005 GDP was approximately $56 billion, resulting in a per capita GDP of about $3,700.
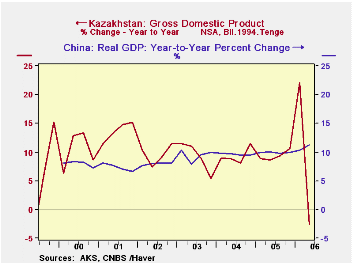
Until the second quarter of this year, Kazakhstan's real GDP growth rivaled that of China. (See the first chart) In the second quarter, however, Kazakhstan reported a decline of 2.53% from the second quarter of 2005. This was the first year to year decline since the first half of 1999. Data on industrial production cast some light on the second quarter decline.Industrial production decelerated sharply in the first quarter and the increase in the second quarter over a year ago was still subdued. 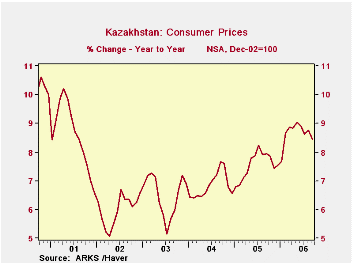 The year over year increase in the third quarter was 11.37%, a rise that suggests that growth in the third quarter GDP is likely to recover. The second chart shows the year to year change in real GDP on a quarterly basis and the year to year change in the quarterly average of industrial production. Inflation, as measured by the year to year increase in the consumer price index has trended up since early 2002 and reached a high of 9.03% in May of this year. It has subsequently declined and was 8.44% in September. The third chart shows the monthly rate of inflation.
| Kazakhstan | -2.53 | 22.12 | 10.64 | 9.31 | 8.56 | 8.87 | 9.41 | 9.37 | |||||||||
| China | 11.3 | 10.3 | 9.9 | 9.8 | 10.1 | 9.9 | 9.9 | 9.6 | |||||||||
| INDUSTRIAL PRODUCTION (Y/Y %) | 2COLSPAN | 2COLSPAN | 2COLSPAN | 2COLSPAN | 2COLSPAN | 2COLSPAN | 2COLSPAN | 2COLSPAN | |||||||||
| Kazakhstan | 7.74 | 2.79 | 7.66 | 9.34 | 11.83 | 12.16 | 10.18 | 13.97 | |||||||||
Tom Moeller
AuthorMore in Author Profile »Prior to joining Haver Analytics in 2000, Mr. Moeller worked as the Economist at Chancellor Capital Management from 1985 to 1999. There, he developed comprehensive economic forecasts and interpreted economic data for equity and fixed income portfolio managers. Also at Chancellor, Mr. Moeller worked as an equity analyst and was responsible for researching and rating companies in the economically sensitive automobile and housing industries for investment in Chancellor’s equity portfolio. Prior to joining Chancellor, Mr. Moeller was an Economist at Citibank from 1979 to 1984. He also analyzed pricing behavior in the metals industry for the Council on Wage and Price Stability in Washington, D.C. In 1999, Mr. Moeller received the award for most accurate forecast from the Forecasters' Club of New York. From 1990 to 1992 he was President of the New York Association for Business Economists. Mr. Moeller earned an M.B.A. in Finance from Fordham University, where he graduated in 1987. He holds a Bachelor of Arts in Economics from George Washington University.
More Economy in Brief
 Global| Feb 05 2026
Charts of the Week: Balanced Policy, Resilient Data and AI Narratives
by:Andrew Cates


