 Global| Mar 28 2005
Singapore's Industrial Production Down Again in February: An Omen for First Quarter GDP?
Summary
The seasonally adjusted index of Industrial production in Singapore declined 9.8% in February after a 6.9% decline in January. Some of the February decline may have been due to the plant shutdowns during the lunar year celebrations [...]
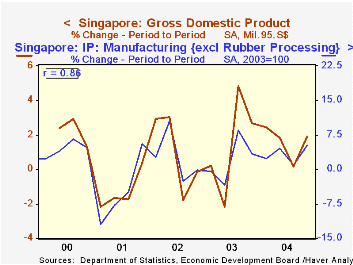
The seasonally adjusted index of Industrial production in Singapore declined 9.8% in February after a 6.9% decline in January. Some of the February decline may have been due to the plant shutdowns during the lunar year celebrations that occurred early in the month. However, the close correlation between the quarterly average of the industrial product index and real gross domestic product (see the first chart) suggests that the trend of industrial production so far this year may lead to a slow advance or even decline in the first quarter GDP, the first estimate of which is scheduled for April 12th. In the first quarter of 2004, a 2.8% increase in industrial production was associated with a 2.4% increase in GDP.
The Economic Development Board of Singapore publishes a seasonally adjusted index only for total industrial product. The EDB publishes unadjusted data for seven "clusters" of manufacturing businesses and their components. Haver seasonally adjusts all the indexes for the economic clusters and their components except the indexes for the Biomedical Manufacturing Cluster and its Pharmaceutical component. In the table below we have used Haver's seasonally adjusted data, except for the Biomedical manufacturing cluster. Also included in the table is the unadjusted index for electronics which we use in the second chart.
On a seasonally adjusted basis, the indexes for the electronics and the transport clusters were the only ones to show a gain in February. The index for the precision engineering cluster was virtually unchanged while the indexes for the chemical, general manufacturing and biomedical manufacturing clusters all declined. The biomedical manufacturing index has been extremely erratic as pharmaceutical makers tend to switch the emphasis on certain drugs and have to shut down plants for changeovers. Also there has been considerable expansion in this cluster as the government has been encouraging the biomedical industry as a means of reducing Singapore's reliance on the electronics industry where growth has been slowing. The second chart compares the unadjusted indexes the electronics and biomedical clusters. Although erratic, the latter shows an upward trend while the former shows a more stable trend.
| Singapore: Manufacturing Clusters | Feb 05 | Jan 05 | Feb 04 | M/M% | Y/Y% | 2004 | 2003 | 2002 |
|---|---|---|---|---|---|---|---|---|
| Electronics | 117.2 | 114.1 | 120.0 | 2.8 | -2.3 | 14.8 | 4.5 | 5.2 |
| Chemicals | 109.2 | 112.8 | 107.9 | -3.2 | 1.2 | 7.91 | 6.49 | 11.1 |
| Precisions Engineering | 106.2 | 106.3 | 122.2 | -0.1 | -13.1 | 2.86 | -0.7 | 2.0 |
| Transport Engineering | 140.8 | 138.3 | 111.1 | 1.8 | 26.7 | 24.0 | -6.0 | 8.9 |
| General Manufacturing Ind | 94.2 | 98.9 | 106.4 | -4.8 | -11.5 | -0.1 | -3.6 | -6.9 |
| Biomedical Mfg (NAS) | 42.2 | 173.3 | 116.1 | -75.6 | -63.6 | 29.8 | 13.4 | 48.6 |
| Total Industrial Production | 107.8 | 119.5 | 108.8 | -9.8 | -0.92 | 13.94 | 3.06 | 8.42 |
| Addendum: | ||||||||
| Electronics (NSA) | 97.9 | 110.0 | 100.3 | -11.0 | -2.39 | 14.8 | 4.5 | 5.2 |
More Economy in Brief


