 Global| Aug 10 2005
Singapore GDP Growth Moderately High at 3% in Q2, But Area Sees Erratic Moves, Possibly Tied to Oil
Summary
Singapore produces, refines and exports oil. Oil supports growth. But it may also make for a more volatile economy than a country with greater diversity. In Q2, Singapore's real GDP grew 3.0%, following a 1.2% decrease in Q1, and a [...]
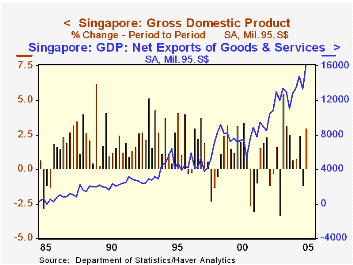
Singapore produces, refines and exports oil. Oil supports growth. But it may also make for a more volatile economy than a country with greater diversity. In Q2, Singapore's real GDP grew 3.0%, following a 1.2% decrease in Q1, and a gain of 5.2% since the year-ago quarter. Growth in 2004 was a strong 8.4%, with domestic spending sectors also running at just about that pace. Private consumption was up 2.1% in the latest quarter, but only 2.3% during the last year, a considerable moderation from 2004's 8.6% surge. Investment, called here "GFCF" -- Gross Fixed Capital Formation -- is similarly erratic, up in Q2, but otherwise tracing a zigzag pattern. Consumption has absorbed a fairly steady 42% of GDP in the last several years, but investment outlays have drifted down to 24% by Q2, a record low in the 30-year-long history of the Singapore national accounts.
Net exports, by contrast, are gaining. Five years ago, they were 18% of real GDP, and in Q2 2005, they were 34% of the total. Similarly, in current prices, oil exports were 13.6% of GDP five years ago, and in Q2, they were 27.5%, slightly more than twice as large a share. 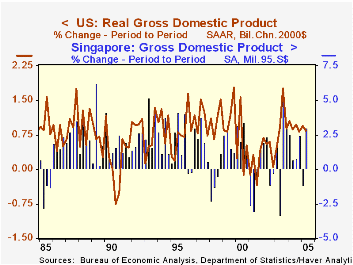
So what about this volatility? In the second graph, we see clearly that Singapore's GDP growth is both stronger and more erratic than that of the US, as indicated by a simple average of quarterly growth rates over a long span of years and the standard deviation accompanying them. Since the US is hardly representative of the world at large, we checked several other countries. The same holds for a diverse group including France, Australia and the Czech Republic: slower but steadier growth than Singapore. South Korea, which does not produce oil for export, nonetheless has as much growth and as much volatility as Singapore. Russia, an oil producer, has seen average quarterly growth similar to the US, but volatility higher than any other of these nations. Clearly the structures of all these economies are far more complex than our simple comparison here, but our result does suggest that reliance on oil can make for unsteady economic performance.
| Singapore | Q2 2005 | Q1 2005 | Q2 2004 | 2004 | 2003 | 2002 |
|---|---|---|---|---|---|---|
| Real GDP | 3.0% | -1.2% | 5.2% | 8.4% | 2.5% | 3.0% |
| Private Consumption | 2.1% | -0.1% | 2.3% | 8.6% | 1.2% | 5.0% |
| GFCF | 1.2% | -1.0% | -4.5% | 8.5% | -5.5% | -8.5% |
| Current Account | S$15.3 | S$12.1 | S$10.7 | S$47.1 | S$47.0 | S$33.8 |
| Exports: Goods (current prices) | 9.9% | -6.2% | 11.4% | 20.8% | 12.3% | 10.2% |
| Imports: Goods (current prices) | 8.0% | -3.7% | 9.8% | 23.7% | 7.9% | 7.0% |
Carol Stone, CBE
AuthorMore in Author Profile »Carol Stone, CBE came to Haver Analytics in 2003 following more than 35 years as a financial market economist at major Wall Street financial institutions, most especially Merrill Lynch and Nomura Securities. She had broad experience in analysis and forecasting of flow-of-funds accounts, the federal budget and Federal Reserve operations. At Nomura Securities, among other duties, she developed various indicator forecasting tools and edited a daily global publication produced in London and New York for readers in Tokyo. At Haver Analytics, Carol was a member of the Research Department, aiding database managers with research and documentation efforts, as well as posting commentary on select economic reports. In addition, she conducted Ways-of-the-World, a blog on economic issues for an Episcopal-Church-affiliated website, The Geranium Farm. During her career, Carol served as an officer of the Money Marketeers and the Downtown Economists Club. She had a PhD from NYU's Stern School of Business. She lived in Brooklyn, New York, and had a weekend home on Long Island.
More Economy in Brief


