 Global| Feb 12 2007
Revenue Surge Benefits U.S. Budget
by:Tom Moeller
|in:Economy in Brief
Summary
The U.S. federal government ran a surplus of $38.2B during January, nearly double the surplus of $21B during January 2006. The monthly figure was near Consensus expectations for a surplus of $40B. Analysts' forecasts of the Federal [...]
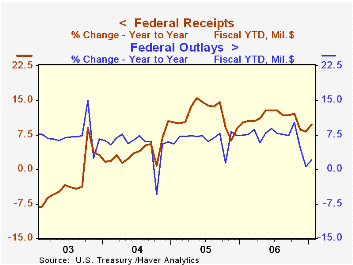
The U.S. federal government ran a surplus of $38.2B during January, nearly double the surplus of $21B during January 2006.
The monthly figure was near Consensus expectations for a surplus of $40B. Analysts' forecasts of the Federal budget benefit from access to the Government's Daily Treasury Statement, the data for which is available in Haver's DAILY database.
The latest figure pulled the deficit for the first third of FY07 to $42.2B, less than half the deficit during last fiscal year's first four months. As a percentage of GDP, the U.S. budget deficit during this year's first four months fell to an insignificant 0.3% of GDP.
Net revenues grew 9.7% y/y during the first four months of FY07. Individual income tax receipts (44% of total receipts) grew 12.6%. Corporate income taxes (13% of total receipts) surged 16.4% as corporate profits grew. Estate & gift taxes grew 7.9% but higher employment levels did not raise unemployment receipts which fell by 3.9%.
U.S. net outlays grew 2.1% during this fiscal year's first four months versus last year driven by a 9.7% surge in defense spending (19% of total outlays). Medicare expenditures (12% of outlays) also surged by 27.2%. Social security spending (21% of outlays) rose 5.7% but the recent bond market rally dropped the government's interest expense by 1.2% y/y.
The latest Budget of the United States Government can be found here.
The State of the U.S. Economy, last week's speech by William Poole, President, Federal Reserve Bank of St. Louis is available here.
| US Government Finance | January | December | Y/Y | FY 2006 | FY 2005 | FY 2004 |
|---|---|---|---|---|---|---|
| Budget Balance | $38.2B | $42.0B | $21.0B (1/06) |
-$247.7 | -$318.7B | -$412.7B |
| Net Revenues | $260.6B | $260.0B | 13.3% | 11.8% | 14.5% | 5.5% |
| Net Outlays | $222.4B | $218.0B | 6.4% | 7.4% | 7.8% | 6.2% |
by Tom Moeller February 12, 2007
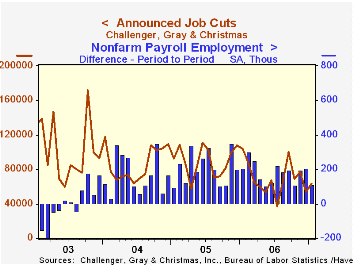
Announced job cuts reported by Challenger, Grey & Christmas in January rose 15.2% to 62,975 and reversed about half of the prior month's decline. The three month moving average of layoff announcements nevertheless declined to 64,797, its lowest level since August.
During the last ten years there has been an 83% (inverse) correlation between the three month moving average level of announced job cuts and the three month change payroll employment.
Layoffs fell sharply m/m in the automotive (-92.6% y/y) and chemical (-87.0% y/y) and financial (+20.4% y/y) industries.
Job cut announcements differ from layoffs. Many are achieved through attrition, early retirement or just never occur.
Challenger also reported that announced hiring plans rose 17.9% m/m (-43.4% y/y).
| Challenger, Gray & Christmas | January | December | Y/Y | 2006 | 2005 | 2004 |
|---|---|---|---|---|---|---|
| Announced Job Cuts | 62,975 | 54,643 | -39.1% | 839,822 | 1,072,054 | 1,039,935 |
by Louise Curley February 12, 2007
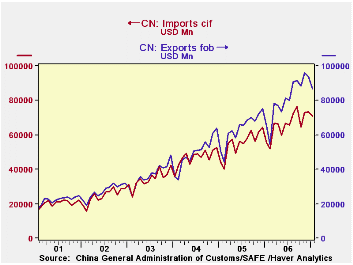
China is one of the first countries to announce its monthly trade data. Selected trade data on a seasonally unadjusted basis for January were released today. In each year since 2001 the unadjusted data on the trade balance have shown a sharp decline from the last quarter of the year to the first quarter of the next.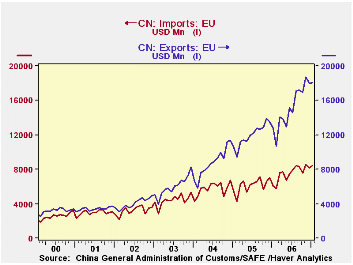 Such appears to be the case this year as the January trade balance was $15.9 billion, 24.4% below December, 2006. Compared to the balance last January, however, the increase was 67.4%, suggesting that China is off to setting another record balance of trade this year. A dramatic change in the yuan/dollar relationship could change this outlook, but such a change does not appear likely at this time. The Group of 7 meeting in Germany last weekend merely appealed to China to increase its currency flexibility. The first chart shows China's exports and imports of goods. The widening gap between the two--the balance of trade is shown in the second chart.
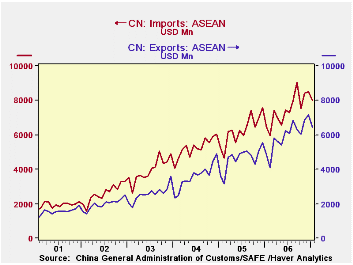
The only geographical areas where export and import data are available for January are the EU and the Association of South Eastern Nations (ASEAN). (ASEAN consist of: Brunei, Cambodia, Indonesia, Laos, Malaysia, Myanmar, Philippines, Singapore, Thailand and Vietnam.) The increasing surplus with the EU is evident in the third chart. One of the few areas where China has a deficit is with ASEAN. The deficit with ASEAN is shown in the fourth chart. The excess of imports from ASEAN over exports to the area appears to be declining gradually over the past four years.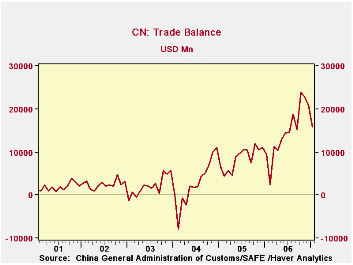
| CHINA TRADE IN GOODS (NSA MIL $) | Jan 05 | Dec 06 | Jan 06 | M/M % | Y/Y % | 2006 | 2005 | 2004 |
|---|---|---|---|---|---|---|---|---|
| Exports | 86,620 | 94,094 | 64,989 | -7.94 | 33.25 | 969,323 | 769,377 | 593,646 |
| Imports | 70,740 | 73,097 | 55,500 | -3.22 | 27.46 | 791,797 | 660,222 | 560,813 |
| Balance | 15,880 | 20,997 | 9,489 | -5,117* | 6,391* | 177,529 | 102,105 | 32,837 |
| Exports to EU | 18,025 | 18,008 | 12,763 | 0.09 | 41.22 | 181,929 | 143,752 | 104,574 |
| Imports from EU | 8,432 | 8,161 | 6,092 | 3.34 | 38.41 | 90,352 | 73,549 | 69,179 |
| Balance | 9,593 | 9,848 | 6,671 | -259* | 2,921* | 91,575 | 70,203 | 35,395 |
| Exports to ASEAN | 6,448 | 7,185 | 4,820 | -10.26 | 33.78 | 71,324 | 53,459 | 49,203 |
| Imports from ASEAN | 8,008 | 8,498 | 6,435 | -5.77 | 24.44 | 89,538 | 75,017 | 62,955 |
| Balance | -1,560 | -1.313 | -1,615 | -246.56* | 55.42* | -18,213 | -19,5558 | -20,052 |
Tom Moeller
AuthorMore in Author Profile »Prior to joining Haver Analytics in 2000, Mr. Moeller worked as the Economist at Chancellor Capital Management from 1985 to 1999. There, he developed comprehensive economic forecasts and interpreted economic data for equity and fixed income portfolio managers. Also at Chancellor, Mr. Moeller worked as an equity analyst and was responsible for researching and rating companies in the economically sensitive automobile and housing industries for investment in Chancellor’s equity portfolio. Prior to joining Chancellor, Mr. Moeller was an Economist at Citibank from 1979 to 1984. He also analyzed pricing behavior in the metals industry for the Council on Wage and Price Stability in Washington, D.C. In 1999, Mr. Moeller received the award for most accurate forecast from the Forecasters' Club of New York. From 1990 to 1992 he was President of the New York Association for Business Economists. Mr. Moeller earned an M.B.A. in Finance from Fordham University, where he graduated in 1987. He holds a Bachelor of Arts in Economics from George Washington University.
More Economy in Brief
 Global| Feb 05 2026
Charts of the Week: Balanced Policy, Resilient Data and AI Narratives
by:Andrew Cates


