 Global| Jun 13 2008
Readings Drop in May: Index to 96.6 in Bottom Quarter of Rank Range
Summary
The Bank of France business indicator fell to 97 from 100.4 in May. After seeing the result the Bank of France cut its growth estimate for GDP to +0.2% down from +0.3% previously for the Q/Q gain. In the latest month production was [...]
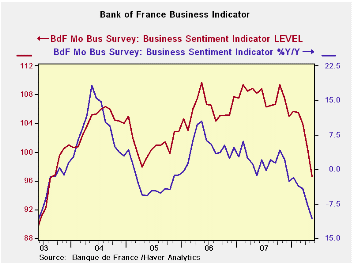
The Bank of France business indicator fell to 97 from 100.4 in May. After seeing the result the Bank of France cut its growth estimate for GDP to +0.2% down from +0.3% previously for the Q/Q gain. In the latest month production was weak. The survey respondents rated it in the bottom one percent of all production ratings since 1988. Even capital equipment was rated as low in the month.
The production outlook fared better with roughly mid-range rankings. Capital goods and consumer goods were particularly strong, above their range mid-points. The consumer goods ranking was in the top 14% of its historic range – a surprisingly strong result.
Demand was rated as solid overall with overall order books assessed as being above their range point in the top 40% of their range. But FOREIGN order books were assessed as very low, in the bottom 4% of its range.
New orders are mixed but weak. Total orders are in the bottom 6% of their range. Capital goods new orders were in the bottom quarter of their range. Consumer goods were in the 47th range percentile, nearly at neutral.
Stocks of goods on hand are mid range or higher as for capital goods and autos. Capacity use is rated as low, a bottom third of range response. Hiring, last month, was in the 33rd percentile of its range; the outlook is still much stronger, in its 80th percentile.
About the ranking percentiles: To derive the ranking percentiles we rank the various components from Jan 1988 to date then express the rank as a percentile of the total with 10% being strong and zero % weak. Ranking percentiles are a bit more useful than range percentiles because they place an observation in a ranking queue instead of being influenced by only the range extremes of high and low as with range percentiles. A bottom 23.7% ranking is a ranking is in the bottom twenty-three percent (bottom quarter of the range) of all readings since 1988.
| Bank of France Monthly INDUSTRY Survey | ||||||
|---|---|---|---|---|---|---|
| Since Jan-87 | Ranking | |||||
| May-08 | Apr-08 | Mar-08 | 12-MO AVERAGE | Average | Percentile | |
| Production-latest mo | ||||||
| Total Industry | -12.41 | 2.44 | -0.22 | 4 | 7 | 0.8% |
| Semi-Finished | -15.57 | 7.01 | -4.1 | 4 | 6 | 0.8% |
| Capital | -9.09 | 11.17 | 1.36 | 8 | 7 | 4.5% |
| Auto | -29.94 | -13.88 | -3.31 | -4 | 7 | 6.1% |
| Consumer | -6.5 | 0.87 | 3.67 | 7 | 8 | 2.9% |
| Agricultural & Food | 0.32 | -8.28 | 1.94 | 4 | 10 | 9.8% |
| Production Outlook | ||||||
| Total Industry | 14.51 | 6.02 | 14.13 | 15 | 15 | 43.7% |
| Semi-Finished | 12.55 | 3.55 | 10.84 | 14 | 13 | 46.1% |
| Capital | 18.86 | 13.35 | 19.97 | 20 | 17 | 50.2% |
| Auto | 16.63 | 12.77 | 14.39 | 17 | 15 | 47.3% |
| Consumer | 22.95 | -7.77 | 16.03 | 12 | 17 | 86.9% |
| Agric&Food | 3.54 | 8.23 | 9.49 | 13 | 17 | 0.8% |
| Demand | ||||||
| Overall order books | 12.1 | 16.01 | 17.7 | 24 | 5 | 59.2% |
| Foreign Orders | -7.36 | 10.21 | 2.1 | 8 | 8 | 4.5% |
| New Orders | ||||||
| Total Industry | -4.65 | 8.46 | 1.59 | 8 | 9 | 6.1% |
| Semi-Finished | -8.92 | 0.9 | -0.27 | 6 | 7 | 9.0% |
| Capital | 3.69 | 14.81 | 5.4 | 10 | 9 | 25.7% |
| Auto | -- | -- | -- | -- | -- | -- |
| Consumer | 10.63 | 9.18 | 7.8 | 13 | 11 | 47.8% |
| Agric&Food | -3.13 | -6.77 | -0.44 | 5 | 11 | 5.7% |
| Stocks: Finished Gds | ||||||
| Total Industry | -1.72 | 0.71 | 0.66 | -2 | -2 | 48.6% |
| Semi-Finished | -4.82 | -1.43 | -2.28 | -2 | -2 | 20.4% |
| Capital | -1.29 | -0.12 | -3.97 | -2 | -3 | 64.9% |
| Auto | 4.85 | 10.82 | 17.42 | -2 | -3 | 75.1% |
| Consumer | 0.19 | 1.23 | 2.19 | -1 | 0 | 44.9% |
| Agricultural & Food | -0.21 | 12.17 | 0.33 | 1 | 0 | 46.1% |
| Capacity Utilization | 82.04 | 83 | 82.99 | 83 | 83 | 31.8% |
| Hiring | ||||||
| Latest Mo | -4.39 | -0.55 | -2.58 | -1 | -1 | 33.5% |
| Outlook | -3.38 | -2.96 | -3.88 | -2 | -3 | 80.8% |
| Industry Sentiment Index | 96.65 | 100.4 | 103.91 | 105 | 106 | 23.7% |
| Ranges, percentiles since January of 1988 | ||||||

Robert Brusca
AuthorMore in Author Profile »Robert A. Brusca is Chief Economist of Fact and Opinion Economics, a consulting firm he founded in Manhattan. He has been an economist on Wall Street for over 25 years. He has visited central banking and large institutional clients in over 30 countries in his career as an economist. Mr. Brusca was a Divisional Research Chief at the Federal Reserve Bank of NY (Chief of the International Financial markets Division), a Fed Watcher at Irving Trust and Chief Economist at Nikko Securities International. He is widely quoted and appears in various media. Mr. Brusca holds an MA and Ph.D. in economics from Michigan State University and a BA in Economics from the University of Michigan. His research pursues his strong interests in non aligned policy economics as well as international economics. FAO Economics’ research targets investors to assist them in making better investment decisions in stocks, bonds and in a variety of international assets. The company does not manage money and has no conflicts in giving economic advice.
More Economy in Brief


