 Global| Sep 30 2009
Q2 GDP Fell A Lessened 0.7%; Hesitant Profits Recovery Continues
by:Tom Moeller
|in:Economy in Brief
Summary
The second revision of GDP growth last quarter showed that activity fell slightly less than initially estimated. A 0.7% (AR) 2Q decline compared to 1.0% declines indicated in the two prior reports. During the course of the numbers' [...]
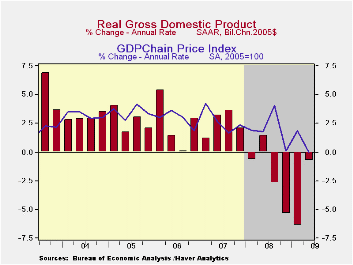 The second
revision of GDP growth last quarter showed that activity fell slightly
less than initially estimated. A 0.7% (AR) 2Q decline compared to 1.0%
declines indicated in the two prior reports. During the course of the
numbers' release, the decline in domestic final demand has been
lessened to 0.9% after a 6.4% collapse to open the year. That easing
has offset an increased negative influence from inventory
decumulation.
The second
revision of GDP growth last quarter showed that activity fell slightly
less than initially estimated. A 0.7% (AR) 2Q decline compared to 1.0%
declines indicated in the two prior reports. During the course of the
numbers' release, the decline in domestic final demand has been
lessened to 0.9% after a 6.4% collapse to open the year. That easing
has offset an increased negative influence from inventory
decumulation.
Inventory decumulation
continued as the major drag on GDP growth last quarter with a 1.4
percentage point reduction that was unrevised. Final demand revisions
were modest. Consumer spending is now estimated to have fallen at a
0.9% annual rate (-1.7% y/y) led by a 5.6% (-8.8% y/y) drop in durables
consumption. Residential investment fell at a little-revised 23.2% rate
-25.6% y/y) and business investment dropped at a 9.6% rate (-19.7% y/y)
which was similar to earlier reports. 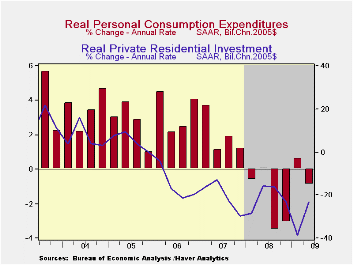 Government investment rose at a
little revised 6.7% rate (2.5% y/y) and exports declined at a lessened
4.1% rate. Imports dropped 14.7%; therefore, net-foreign trade
improvement added 1.7 percentage points to 2Q GDP growth.
Government investment rose at a
little revised 6.7% rate (2.5% y/y) and exports declined at a lessened
4.1% rate. Imports dropped 14.7%; therefore, net-foreign trade
improvement added 1.7 percentage points to 2Q GDP growth.
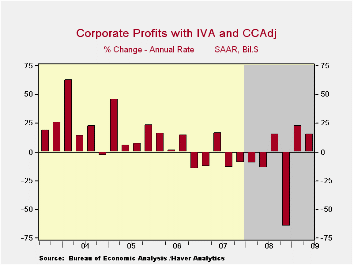
Corporate profits in Q2 rose 3.7% (-12.6% y/y) pre-tax, including IVA and CCA, from Q1 which was slightly less of a rise than reported initially. The latest gain followed a 5.3% 1Q increase but both just dented a 22.8% 4Q decline. Financial industries saw their quarterly profits gain 12.0% in Q2 (-1.8% y/y) after having nearly doubled in Q1 versus 4Q. Nonfinancial company profits improved last quarter by a marginally unrevised 4.7% (-7.5% y/y). Rest of world profits fell for the fifth quarter in the last six and by 4.6% (-17.9% y/y).
The GDP price deflator was unrevised and was unchanged from 1Q. A 1.4% gain (-0.2% y/y) in the PCE price index followed a 1.5% 1Q decline. Overall, the domestic final sales price index rose at a negligible 0.5% rate (-0.3% y/y).
The U.S. National Income & Product Account data are available in Haver's USECON and the USNA databases.
Excerpts from Dallas Fed Chairman Richard W. Fisher's remarks before the Texas Christian University Business Network of Dallas can be found here.
| Chained 2005$, % AR | 2Q '09 (3rd Release) | 2Q '09 (2nd Release) | 2Q '09 (Advance) | 1Q '09 | 2Q Y/Y | 2008 | 2007 | 2006 |
|---|---|---|---|---|---|---|---|---|
| GDP | -0.7 | -1.0 | -1.0 | -6.4 | -3.8 | 0.4 | 2.1 | 2.7 |
| Inventory Effect | -1.4 | -1.4 | -0.8 | -2.4 | -1.0 | -0.4 | -0.4 | 0.1 |
| Final Sales | 0.7 | 0.4 | -0.2 | -4.1 | -2.8 | 0.8 | 2.5 | 2.6 |
| Foreign Trade Effect | 1.7 | 1.6 | 1.4 | 2.6 | 0.9 | -1.2 | 0.8 | 0.1 |
| Domestic Final Demand | -0.9 | -1.2 | -1.5 | -6.4 | -3.7 | -0.4 | 1.7 | 2.5 |
| Chained GDP Price Index | 0.0 | 0.0 | 0.2 | 1.9 | 1.5 | 2.1 | 2.9 | 3.3 |

Tom Moeller
AuthorMore in Author Profile »Prior to joining Haver Analytics in 2000, Mr. Moeller worked as the Economist at Chancellor Capital Management from 1985 to 1999. There, he developed comprehensive economic forecasts and interpreted economic data for equity and fixed income portfolio managers. Also at Chancellor, Mr. Moeller worked as an equity analyst and was responsible for researching and rating companies in the economically sensitive automobile and housing industries for investment in Chancellor’s equity portfolio. Prior to joining Chancellor, Mr. Moeller was an Economist at Citibank from 1979 to 1984. He also analyzed pricing behavior in the metals industry for the Council on Wage and Price Stability in Washington, D.C. In 1999, Mr. Moeller received the award for most accurate forecast from the Forecasters' Club of New York. From 1990 to 1992 he was President of the New York Association for Business Economists. Mr. Moeller earned an M.B.A. in Finance from Fordham University, where he graduated in 1987. He holds a Bachelor of Arts in Economics from George Washington University.
More Economy in Brief


