 Global| Mar 18 2004
Producer Prices Surged in January
by:Tom Moeller
|in:Economy in Brief
Summary
Finished producer prices surged 0.6% in January. The increase was the largest since October of last year. The core PPI rose 0.3% following two months of flat-to-down prices. Release of the figures was delayed due to the conversion to [...]
Finished producer prices surged 0.6% in January. The increase was the largest since October of last year. The core PPI rose 0.3% following two months of flat-to-down prices.
Release of the figures was delayed due to the conversion to the 2002 North American Industry Classification System (NAICS) from the 1987 Standard Industrial Classification (SIC). The change affects industry breakdowns. The product-type breakdowns which are the usual focus of attention should not be meaningfully impacted. Seasonal adjustment factors also were recalculated.
Finished consumer goods prices rose 0.7% in January (4.0% y/y). Less food & energy finished consumer goods prices rose 0.3% (+0.9% y/y). Consumer durable prices rose 0.4% (1.1% y/y) and reversed a December decline. Core non-durable prices jumped 0.7% (0.7% y/y).
Finished capital goods prices rose 0.3% (+1.1% y/y).
Finished energy prices rose 4.7% (11.3% y/y) on the strength of higher gasoline (13.0% y/y) and fuel oil (10.9% y/y) prices. These energy product price series are NSA.
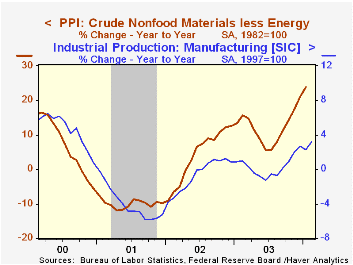
Intermediate goods prices jumped 0.9% as energy prices rose. Core intermediate prices, up 0.6%, also rose the most for any month since February 2003.
Crude goods prices surged 2.8% as energy prices jumped 12.5% (11.8% y/y). Core crude prices also rose 3.3%, strong for the seventh consecutive month.
| Producer Price Index | Jan | Dec | Y/Y | 2003 | 2002 | 2001 |
|---|---|---|---|---|---|---|
| Finished Goods | 0.6% | 0.2% | 3.3% | 3.2% | -1.3% | 2.0% |
| Core | 0.3% | -0.1% | 0.9% | 0.2% | 0.1% | 1.4% |
| Intermediate Goods | 0.8% | 0.4% | 3.7% | 4.7% | -1.5% | 0.4% |
| Core | 0.6% | 0.1% | 2.3% | 2.0% | -0.5% | -0.1% |
| Crude Goods | 2.8% | 2.2% | 13.6% | 25.1% | -10.6% | 0.3% |
| Core | 3.3% | 3.0% | 23.9% | 12.2% | 3.8% | -10.0% |
by Tom Moeller March 18, 2004
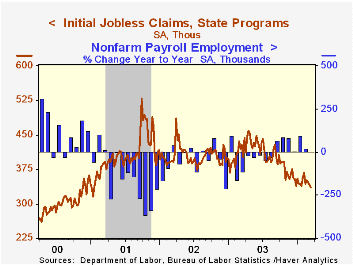
Initial claims for jobless insurance fell another 6,000 to 336,000 last week. The Consensus expectation was for 340,000 claims. The prior week was revised up slightly.
The latest figure covers the survey period for March nonfarm payrolls. Claims fell 8,000 (2.3%) from the February period.
During the last ten years there has been a 77% (negative) correlation between the level of initial claims and the three-month change in non-farm payrolls.
The four-week moving average of initial claims fell to 344,000 (-18.9% y/y).
Continuing claims for unemployment insurance rose 47,000 from the prior week's level that was revised to show a 55,000 decline.
The insured rate of unemployment was unchanged at 2.4% for the fourth week.
| Unemployment Insurance (000s) | 3/13/04 | 3/06/04 | Y/Y | 2003 | 2002 | 2001 |
|---|---|---|---|---|---|---|
| Initial Claims | 336.0 | 342.0 | -21.5% | 403 | 404 | 406 |
| Continuing Claims | -- | 3,064 | -13.3% | 3,535 | 3,575 | 3,022 |
by Tom Moeller March 18, 2004
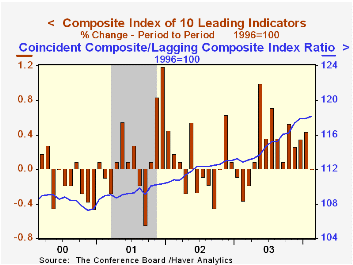
The Composite Index of Leading Economic Indicators reported by the Conference Board was unchanged in February, about as expected. January's 0.5% gain was revised down slightly.
The soft one-month reading was dominated by lower consumer expectations which subtracted 0.2 percentage points. The breadth-of-gain amongst the leaders' component series improved slightly to 60% from a downwardly revised 50% in January. Over a six-month span 80% of the leading series rose.
The Leading index is based on eight previously reported economic data series and two that are estimated.
The coincident indicators rose 0.3%, the strongest gain since November.
The ratio of coincident-to-lagging indicators rose to another record level. The ratio is an indicator of excess relative to actual economic performance.
Visit the Conference Board's site for coverage of leading indicator series from around the world.
| Business Cycle Indicators | Feb | Jan | Y/Y | 2003 | 2002 | 2001 |
|---|---|---|---|---|---|---|
| Leading | 0.0% | 0.4% | 4.1% | 1.3% | 2.2% | -0.8% |
| Coincident | 0.3% | 0.1% | 1.7% | 0.4% | -0.5% | -0.5% |
| Lagging | 0.0% | 0.1% | -3.0% | -2.2% | -2.8% | -1.4% |
by Tom Moeller March 18, 2004
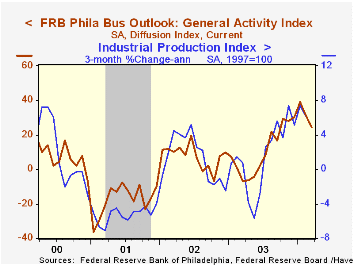
The Philadelphia Fed’s March index of general business conditions in the manufacturing sector fell to 24.2 versus 31.4 last month. Consensus expectations had been for less of a decline to 29.0.
During the last twenty years there has been a 62% correlation between the level of the Philadelphia Fed Business Conditions Index and quarterly growth in real GDP. The correlation with quarterly growth in factory sector industrial production has been 76%.
Amongst the sub indexes, new orders fell sharply to 21.9 versus a high of 37.9 in December. Shipments improved slightly to 22.3 and the employment index was roughly stable at 12.3, a level consistent with expanding factory sector employment.
The business conditions index reflects a separate survey question, not the sub indexes.
A separate survey of expected business conditions in six months fell sharply to 36.7, the lowest level since February 2003.
The prices paid index surged again to 53.4, the highest level since January 1995.
The Philadelphia Fed index is based on a survey of 250 regional manufacturing firms, but these firms sell nationally and internationally.
The latest Business Outlook survey from the Philadelphia Federal Reserve Bank can be found here.
| Philadelphia Fed Business Outlook | Mar | Feb | Mar '03 | 2003 | 2002 | 2001 |
|---|---|---|---|---|---|---|
| General Activity Index | 24.2 | 31.4 | -6.8 | 10.6 | 7.7 | -17.2 |
| Prices Paid Index | 53.4 | 43.7 | 21.2 | 16.7 | 12.2 | -0.9 |

Tom Moeller
AuthorMore in Author Profile »Prior to joining Haver Analytics in 2000, Mr. Moeller worked as the Economist at Chancellor Capital Management from 1985 to 1999. There, he developed comprehensive economic forecasts and interpreted economic data for equity and fixed income portfolio managers. Also at Chancellor, Mr. Moeller worked as an equity analyst and was responsible for researching and rating companies in the economically sensitive automobile and housing industries for investment in Chancellor’s equity portfolio. Prior to joining Chancellor, Mr. Moeller was an Economist at Citibank from 1979 to 1984. He also analyzed pricing behavior in the metals industry for the Council on Wage and Price Stability in Washington, D.C. In 1999, Mr. Moeller received the award for most accurate forecast from the Forecasters' Club of New York. From 1990 to 1992 he was President of the New York Association for Business Economists. Mr. Moeller earned an M.B.A. in Finance from Fordham University, where he graduated in 1987. He holds a Bachelor of Arts in Economics from George Washington University.
More Economy in Brief


