 Global| Jul 15 2004
Producer Prices Fell Unexpectedly
by:Tom Moeller
|in:Economy in Brief
Summary
The June PPI fell 0.3%, the first m/m decline since November. Consensus expectations had been for a 0.2% rise.In line with expectations was the 0.2% rise in the "core" PPI. Energy prices fell 1.6% (9.4% y/y), led lower by an 8.1% [...]
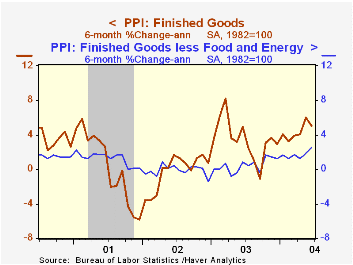
The June PPI fell 0.3%, the first m/m decline since November. Consensus expectations had been for a 0.2% rise.In line with expectations was the 0.2% rise in the "core" PPI.
Energy prices fell 1.6% (9.4% y/y), led lower by an 8.1% (+29.9% y/y) decline in gasoline prices and a 1.5% (+28.6% y/y) drop in duel oil prices.
Prices of finished consumer goods less food & energy rose a modest 0.1% (1.9% y/y). Consumer durable prices again were firm and rose 0.5% (+2.5% y/y) but core non-durable prices fell 0.2% (+1.5% y/y).
Finished capital goods prices rose 0.2% (1.7% y/y).
Intermediate goods prices rose a firm 0.5% last month. Core intermediate prices rose the same 0.5% (5.7% y/y), though plywood prices fell 10.5% (34.9% y/y). Steel (40.0% y/y) & aluminum (7.1% y/y) prices were quite strong.
Crude goods prices jumped 1.6% due to higher energy prices, up 7.7% (14.0% y/y). Core crude prices fell for the third consecutive month though more recently the decline in commodity prices has moderated.
| Producer Price Index | June | May | Y/Y | 2003 | 2002 | 2001 |
|---|---|---|---|---|---|---|
| Finished Goods | -0.3% | 0.8% | 4.0% | 3.2% | -1.3% | 2.0% |
| Core | 0.2% | 0.3% | 1.9% | 0.2% | 0.1% | 1.4% |
| Intermediate Goods | 0.5% | 1.1% | 7.0% | 4.7% | -1.5% | 0.4% |
| Core | 0.5% | 0.9% | 5.7% | 2.0% | -0.5% | -0.1% |
| Crude Goods | 1.6% | 2.8% | 18.9% | 25.1% | -10.6% | 0.3% |
| Core | -0.5% | -3.8% | 20.8% | 12.4% | 3.8% | -10.0% |
by Tom Moeller July 15, 2004
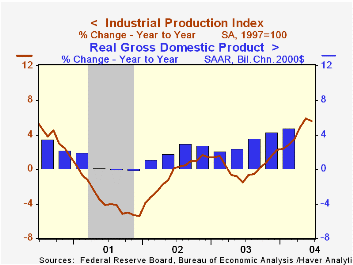
Industrial production unexpectedly fell 0.3% last month following a downwardly revised 0.9% rise in May. Consensus expectations had been for a 0.1% uptick.
Production in the factory sector fell 0.1% (5.8% y/y) but the May gain was revised down to 0.6% from 0.9%.
Lower output of motor vehicles accounted for some of last month's weakness as it fell 3.7%, the third sharp decline in the last four months. Excluding motor vehicles, non-tech output was unchanged (+4.7% y/y). Furniture output fell for the third month in four (0.4% y/y). Non-durables output was unchanged (+3.3% y/y).
Output in selected high-technology industries was strong again, up 2.4% m/m (29.4% y/y). Output of semiconductors rose 2.3% (44.3% y/y) and output of computers & peripheral equipment surged 3.0% (30.7% y/y). Output of communications equipment also rose 1.9% (2.5% y/y).
Total capacity utilization fell to 77.2% and growth in capacity rose to 1.3% y/y.
| Production & Capacity | June | May | Y/Y | 2003 | 2002 | 2001 |
|---|---|---|---|---|---|---|
| Industrial Production | -0.3% | 0.9% | 5.6% | 0.3% | -0.6% | -3.4% |
| Capacity Utilization | 77.2% | 77.6% | 74.0%(6/03) | 74.8% | 75.6% | 77.4% |
by Tom Moeller July 15, 2004
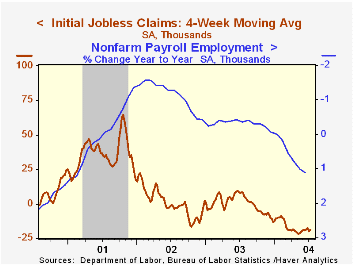
Initial claims for jobless insurance rebounded 40,000 last week to 349,000 following the 40,000 drop the prior week. Consensus expectations had been for 345,000 claims.
Recently volatility probably reflects difficulties in seasonally adjusting the regular layoff of autoworkers due to assembly plant closings to prepare for the new model year.
The 4-week moving average of initial claims rose to 339,000 (-18.8% y/y).
Continuing claims for unemployment insurance rose 112,000 following a 98,000 decline the prior week.
The insured rate of unemployment ticked up to 2.4%.
| Unemployment Insurance (000s) | 7/10/04 | 7/03/04 | Y/Y | 2003 | 2002 | 2001 |
|---|---|---|---|---|---|---|
| Initial Claims | 349 | 309 | -15.1% | 403 | 404 | 406 |
| Continuing Claims | -- | 2,971 | -18.0% | 3,533 | 3,573 | 3,023 |
by Tom Moeller July 15, 2004
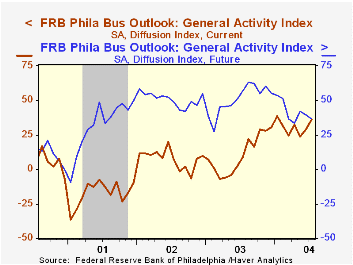
The Philadelphia Fed’s July index of general business conditions in the manufacturing sector rose much more than expected to 36.1. The 7.2 point increase versus June outpaced Consensus expectations for a decline to 25.0.
During the last ten years there has been a 57% correlation between the level of the Philadelphia Fed Business Conditions Index and m/m growth in factory sector industrial production.
Each of the sub indexes improved m/m with the exception of inventories and the workweek.
The business conditions index reflects a separate survey question, not the sub indexes.
The separate index of expected business conditions in six months slid for the sixth month this year to 36.3, just about the lowest level since the peak last August.
The prices paid index fell to the lowest level since February.
The Philadelphia Fed index is based on a survey of 250 regional manufacturing firms, but these firms sell nationally and internationally.
The latest Business Outlook survey from the Philadelphia Federal Reserve Bank can be found here.
| Philadelphia Fed Business Outlook | July | June | July '03 | 2003 | 2002 | 2001 |
|---|---|---|---|---|---|---|
| General Activity Index | 36.1 | 28.9 | 8.7 | 10.6 | 7.7 | -17.2 |
| Prices Paid Index | 46.3 | 51.9 | -5.1 | 16.7 | 12.2 | -0.9 |
by Tom Moeller July 15, 2004
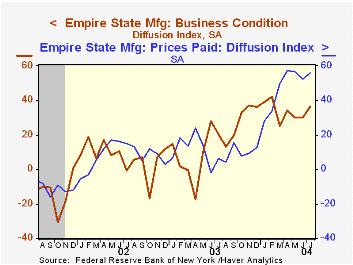
The Empire State Index of General Business Conditions for July erased losses in the prior two months and rose 6.6 points to 36.54, the highest level since February. Consensus expectations had been for a decline to 27.8 and the June level was revised down.
All of the subgroups of the survey improved versus June. Like the Philadelphia Fed Index of General Business Conditions, the Empire State Business Conditions Index reflects answers to an independent survey question, not the components.
The prices paid index rose moderately to 56.03, reversing most of the prior two months' decline from the record high.
The July index of expectations for business conditions six months ahead fell slightly. Expectations for capital expenditures fell for the third consecutive month.
The Empire State Manufacturing Survey is a monthly survey of manufacturers in New York State conducted by the Federal Reserve Bank of New York. Participants from across the state in a variety of industries respond to a questionnaire and report the change in a variety of indicators from the previous month. Respondents also state the likely direction of these same indicators six months ahead. April 2002 is the first report, although survey data date back to July 2001.
For more on the Empire State Manufacturing Survey, including methodologies and the latest report, click here.
| Empire State Manufacturing Survey | July | June | 7/03 | 2003 | 2002 | 2001 |
|---|---|---|---|---|---|---|
| General Business Conditions (diffusion index) | 36.54 | 29.93 | 20.20 | 16.30 | 7.02 | -13.57 |
by Tom Moeller July 15, 2004
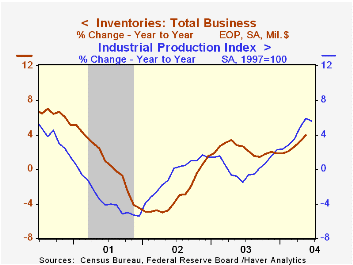
Total business inventories rose 0.4% in May following the upwardly revised 0.7% gain in April. It was the ninth consecutive monthly increase. Consensus expectations were for a 0.5% rise.
Retail inventories fell slightly following an upwardly revised 1.3% gain in April. Lower auto inventories accounted for all of the decline. Non-auto inventories rose 0.6% for the eighth increase in the last nine months. Gains were strong and across the board except general merchandise.
Inventory additions lead production gains. During the last ten years there has been a 46% correlation between the three month change in business inventories and the three month change in US factory production. That correlation rises to 65% when the production gain is lagged three months.
Overall business sales jumped 0.7% (+12.3% y/y) led by a 1.5% gain in retail sales.
The ratio of inventories-to-sales held at the record low of 1.30 for the third consecutive month.
| Business Inventories | May | April | Y/Y | 2003 | 2002 | 2001 |
|---|---|---|---|---|---|---|
| Total | 0.4% | 0.7% | 4.0% | 1.9% | 1.5% | -4.5% |
| Retail | -0.0% | 1.3% | 5.9% | 4.9% | 6.0% | -2.8% |
| Retail excl. Autos | 0.6% | 0.7% | 4.9% | 3.0% | 2.6% | -1.1% |
| Wholesale | 1.2% | 0.2% | 5.6% | 2.2% | 0.4% | -4.5% |
| Manufacturing | 0.5% | 0.5% | 1.1% | -1.3% | -1.8% | -6.1% |

Tom Moeller
AuthorMore in Author Profile »Prior to joining Haver Analytics in 2000, Mr. Moeller worked as the Economist at Chancellor Capital Management from 1985 to 1999. There, he developed comprehensive economic forecasts and interpreted economic data for equity and fixed income portfolio managers. Also at Chancellor, Mr. Moeller worked as an equity analyst and was responsible for researching and rating companies in the economically sensitive automobile and housing industries for investment in Chancellor’s equity portfolio. Prior to joining Chancellor, Mr. Moeller was an Economist at Citibank from 1979 to 1984. He also analyzed pricing behavior in the metals industry for the Council on Wage and Price Stability in Washington, D.C. In 1999, Mr. Moeller received the award for most accurate forecast from the Forecasters' Club of New York. From 1990 to 1992 he was President of the New York Association for Business Economists. Mr. Moeller earned an M.B.A. in Finance from Fordham University, where he graduated in 1987. He holds a Bachelor of Arts in Economics from George Washington University.
More Economy in Brief


