 Global| Sep 04 2025
Charts of the Week: A Few Cuts More
by:Andrew Cates
|in:Economy in Brief
Summary
Equity markets have lost a little ground in recent days and bond markets have been more jittery, as legal challenges to US tariff policies add to a tense backdrop of geopolitical meetings between China, Russia, and India. Gold’s surge to record highs arguably captures the search for safe havens amid this uncertainty (chart 1), while the possibility of tariff reversals keeps alive the prospect of relief for the most affected exporters, notably China, Japan, and South Korea (chart 2). India’s position looks more precarious, with its reliance on the US market colliding with a weakening trade-weighted currency as tariffs bite into growth and investor confidence (chart 3). Monetary policy expectations, however, continue to offer some support, with the latest Blue Chip Financial Forecasts survey pointing to sizeable easing in the US and UK (chart 4). The ECB is expected to tread more cautiously after earlier cuts and with headline inflation now near target. Still, if inflation continues to ease, further action remains possible (chart 5). In the US, corporate resilience is also helping offset some of the gloom: despite tariff-driven spikes in non-labour costs, falling unit labour costs—possibly aided by AI productivity gains—and firmer prices allowed profits per unit of output to rise in Q2 (chart 6).
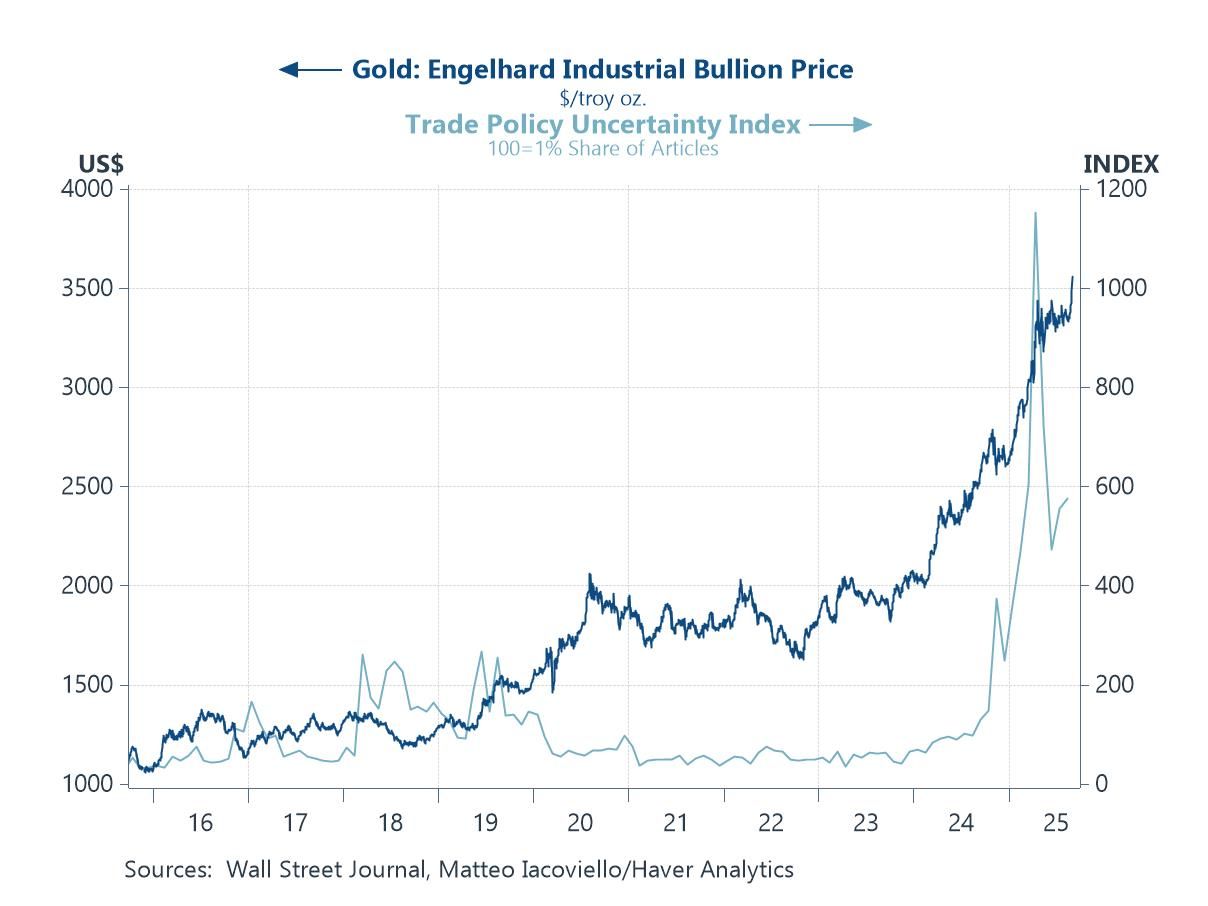
Gold prices and trade policy uncertainty This week’s record-breaking surge in gold prices has coincided with renewed volatility in trade policy uncertainty, reflecting the market’s heightened sensitivity to political and legal developments in Washington. A series of legislative challenges to the administration’s latest tariff measures has raised the prospect that parts of the policy framework could be overturned or significantly diluted. That possibility has injected another layer of uncertainty into an already fragile trade environment, amplifying demand for gold as a hedge. Investors appear to be weighing not only the inflationary risks of tariffs that remain in place but also the destabilizing effects of unpredictable policy reversals, leaving gold prices at historic highs and the trade policy uncertainty index elevated.
Chart 1: The Gold Price versus a Trade Policy Uncertainty Index
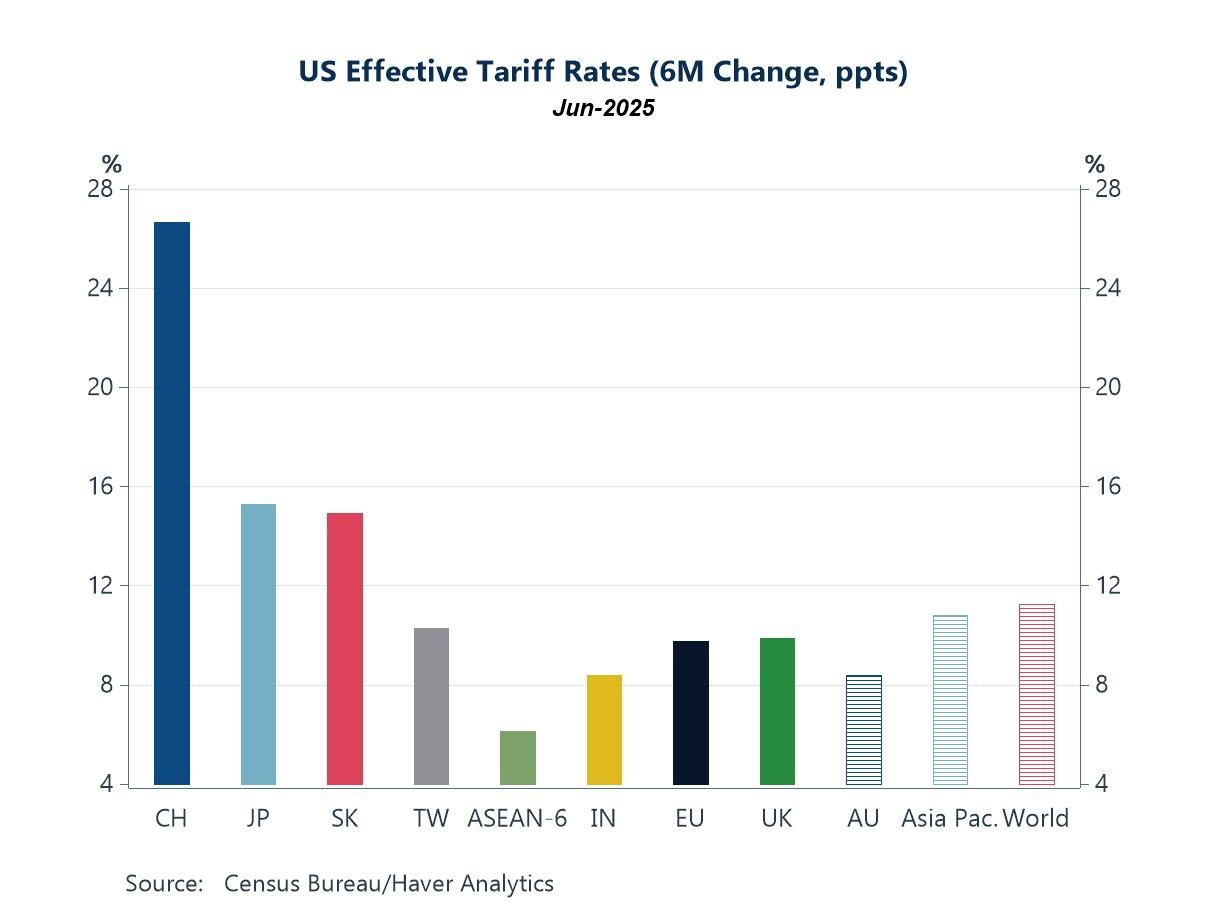
US Tariffs Although the data in this chart extend only through June 2025, they clearly illustrate which trading partners would gain the most if US tariff policies were to be reversed. China stands out as the most heavily penalised, with effective tariff rates rising by more than 25 percentage points in just six months. Japan and South Korea have also faced significant tariff hikes, suggesting that their exporters would benefit substantially from any policy rollback. Taiwan, India, and the EU also feature prominently, though at more moderate levels. By contrast, ASEAN economies, Australia, and the UK have seen relatively smaller increases, leaving them less exposed. In aggregate, a broad reversal of tariffs would most immediately alleviate the pressure on East Asian exporters—particularly China—while also reducing costs for US importers and consumers who have been disproportionately affected by higher prices on goods from the region.
Chart 2: US Effective Tariff Rates, 6-month changes
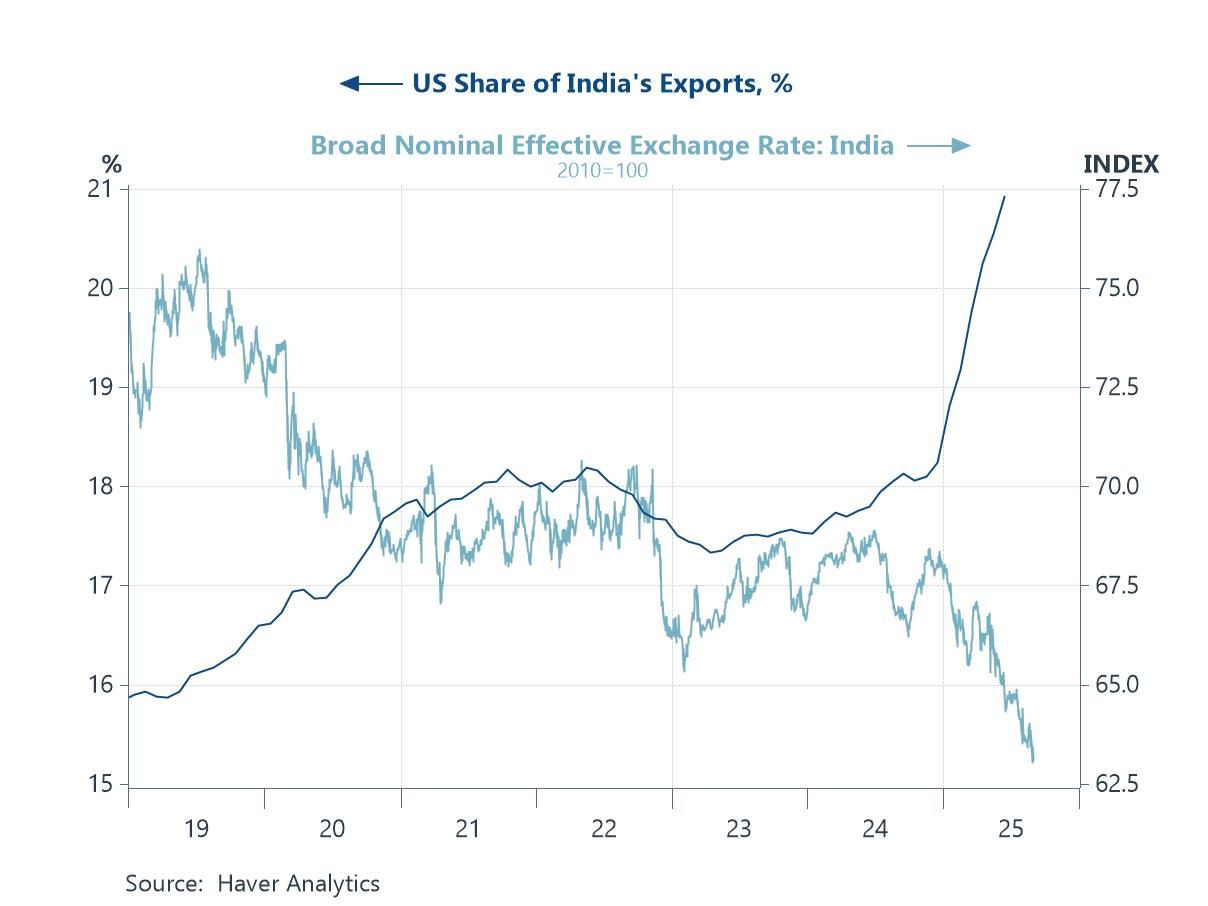
The Indian economy and US trade policy India faces a particularly sharp squeeze from the latest wave of US tariff hikes, given that the US now absorbs nearly one-fifth of its exports. The imposition of higher barriers has dealt a direct blow to key sectors, such as textiles and jewellery, while also undermining investor confidence. That pressure is clearly visible in the sharp depreciation of India’s trade-weighted currency, which has accelerated in 2025. Rather than offering a competitiveness boost, the weaker rupee has compounded difficulties by lifting import costs and stoking inflation at home. The result is that tariffs have both curtailed India’s export earnings and strained its domestic economy, leaving policymakers with limited options beyond seeking trade diversification and targeted support measures.
Chart 3: India: US export exposure versus Haver’s nominal effective exchange rate
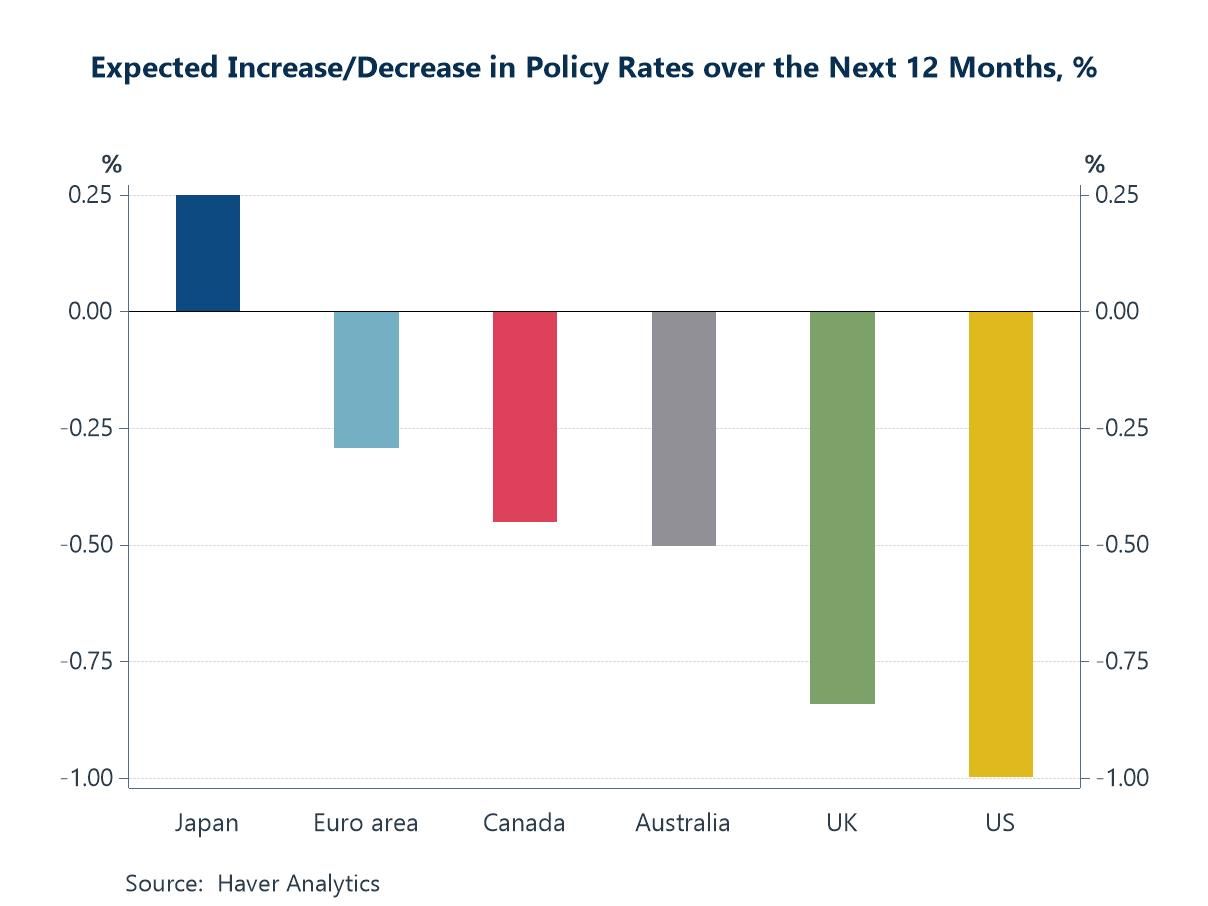
Global monetary policy The latest Blue Chip Financial Forecasts survey helps explain why equity markets have remained upbeat despite escalating geopolitical and trade tensions. The survey points to an expected sizeable policy easing over the coming year, particularly in the US and UK where forecasters anticipate close to a full percentage point of rate cuts. Australia and Canada are also projected to deliver meaningful reductions, while the euro area is expected to ease more modestly. Japan stands out as the exception, with expectations tilted toward further tightening. For equities, these projections of broad-based rate cuts provide a crucial cushion—supporting valuations, lowering discount rates, and reinforcing the sense that policymakers are prepared to offset the drag from tariffs and slowing global growth.
Chart 4: Blue Chip Financial Forecasts: Expected change in policy rates over the next 12 months
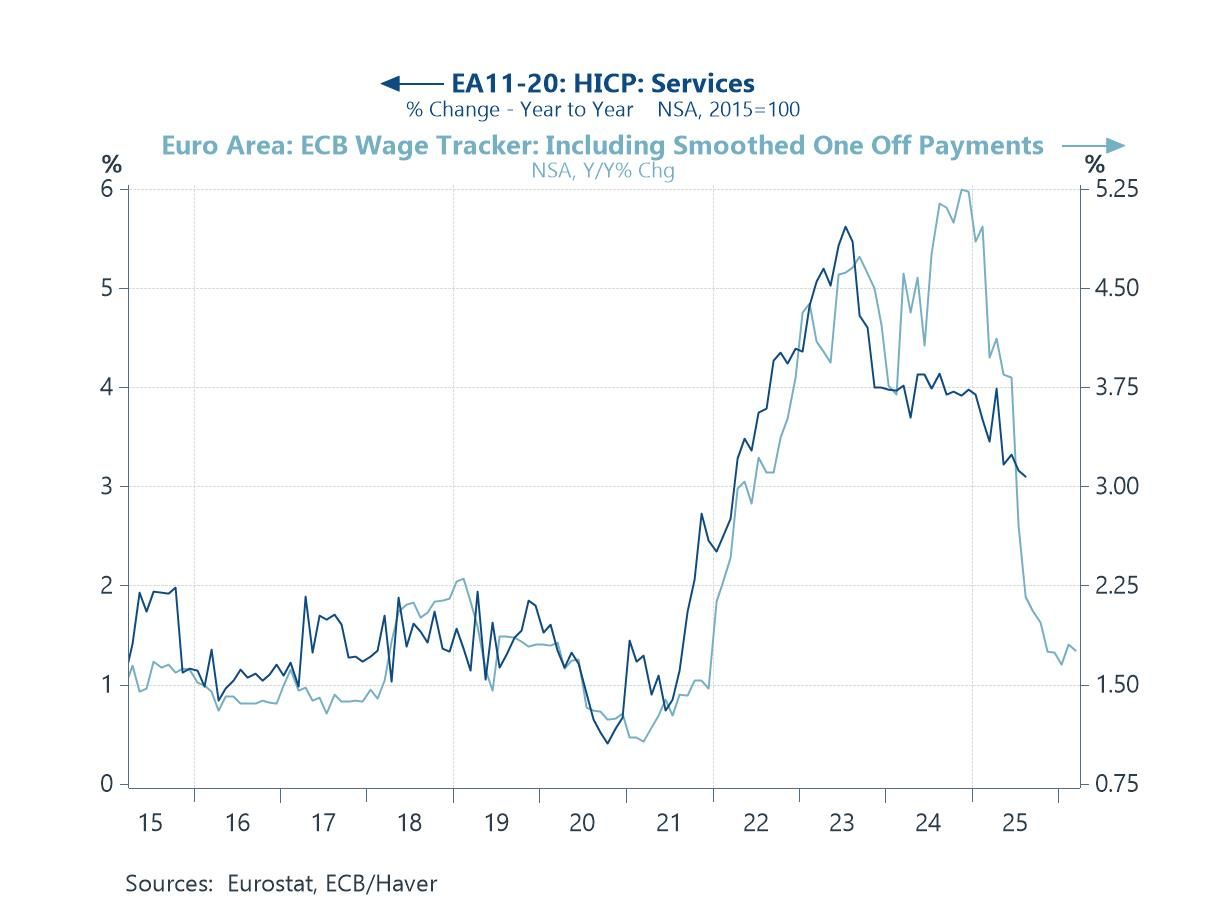
Euro area inflation By contrast with the US and UK, where forecasters in the latest Blue Chip Financial Forecasts survey anticipate close to a full percentage point of rate cuts, expectations for the ECB are more restrained. This reflects the fact that the ECB has already delivered a relatively large degree of policy easing, while headline inflation has now fallen back to levels close to its target. Even so, further rate reductions remain likely if underlying price pressures continue to moderate. As the chart shows, services inflation has begun to move lower in line with a clear decline in wage growth, suggesting that disinflationary momentum is building. Should this trend persist, the ECB will have scope to add to its easing cycle, though at a slower and more cautious pace than peers such as the Fed or the Bank of England.
Chart 5: Euro area: Services CPI inflation versus the ECB’s Wage Tracker
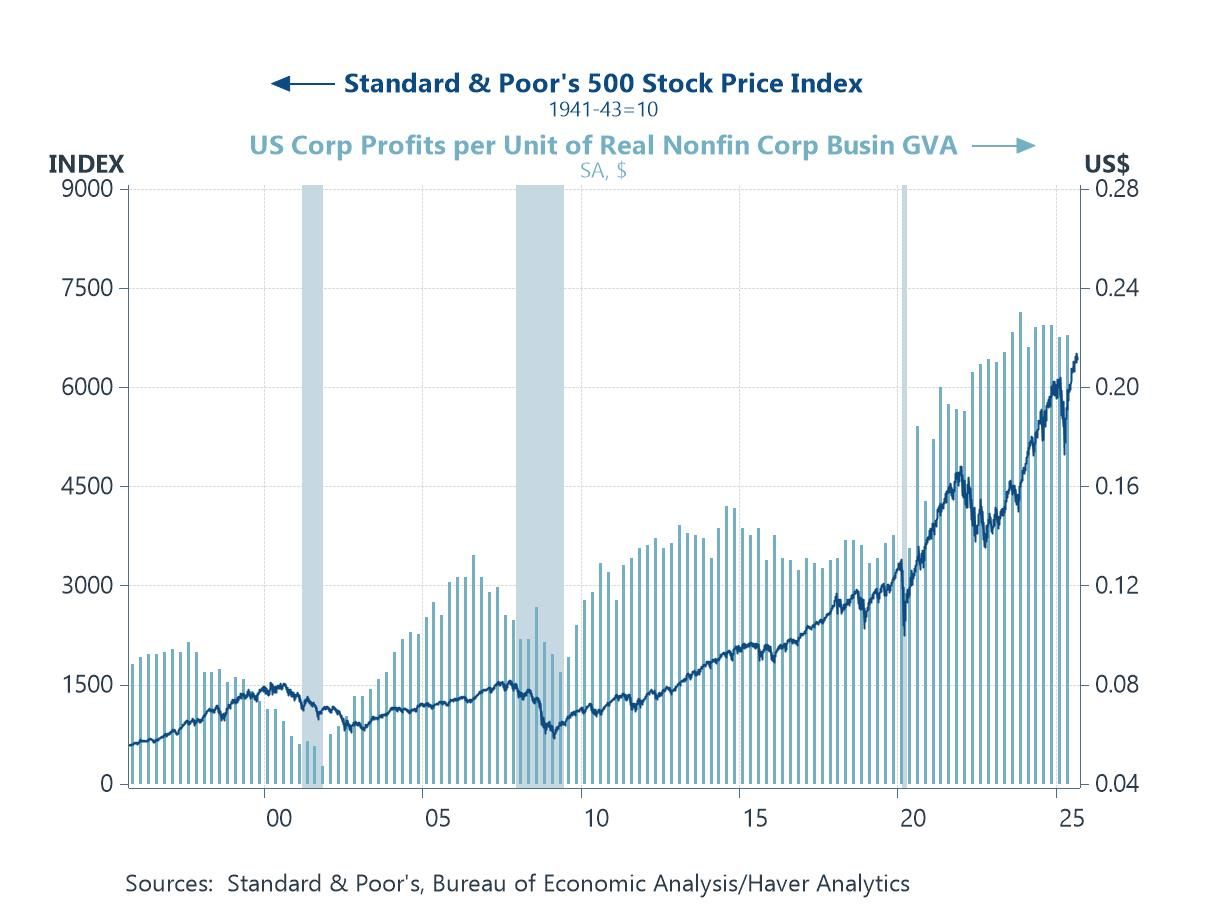
Prices and cost pressures in the US corporate sector Corporate profitability has long been one of the best leading signals for US equity cycles, and the measure here (Non-financial corporate profits per unit of output – i.e. profit margins) has slipped from its late-2023 peak and moved sideways for much of the past year. That’s not a collapse, but it does raise questions about how long equities can keep rising without stronger profit momentum. The recent Q2 uptick—a 1.8% annualised gain—came despite a hefty rise in non-labour costs, with margins protected by modest pricing power and a notable 2.2% drop in unit labour costs. Whether that labour relief reflects softer wage pressures or a structural productivity boost—potentially tied to AI—will be crucial in determining if profits can remain resilient, or if this plateau is the prelude to a downturn.
Chart 6: Prices, Costs and Profits per unit of Output of the US Corporate Sector

Andrew Cates
AuthorMore in Author Profile »Andy Cates joined Haver Analytics as a Senior Economist in 2020. Andy has more than 25 years of experience forecasting the global economic outlook and in assessing the implications for policy settings and financial markets. He has held various senior positions in London in a number of Investment Banks including as Head of Developed Markets Economics at Nomura and as Chief Eurozone Economist at RBS. These followed a spell of 21 years as Senior International Economist at UBS, 5 of which were spent in Singapore. Prior to his time in financial services Andy was a UK economist at HM Treasury in London holding positions in the domestic forecasting and macroeconomic modelling units. He has a BA in Economics from the University of York and an MSc in Economics and Econometrics from the University of Southampton.
More Economy in Brief


