 Global| Dec 20 2005
PPI Down 0.7%, Core Tame
by:Tom Moeller
|in:Economy in Brief
Summary
The November Producer Price Index reversed the prior month's gain and fell 0.7%. The decline was the largest for any month since April 2003 andslightly exceeded Consensus expectations for a 0.5% drop. In a reverse of the prior month's [...]
The November Producer Price Index reversed the prior month's gain and fell 0.7%. The decline was the largest for any month since April 2003 andslightly exceeded Consensus expectations for a 0.5% drop.
In a reverse of the prior month's strength, home heating oil prices fell 15.5% (+30.5% y/y) and natural gas prices declined 0.5% (+31.0% y/y), both seasonally adjusted. Gasoline prices added to the prior month's drop with a 10.7% (+19.4% y/y) decline.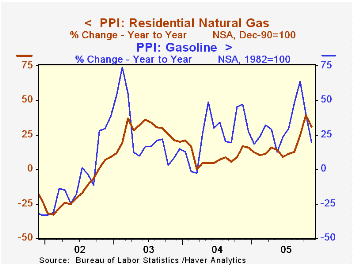
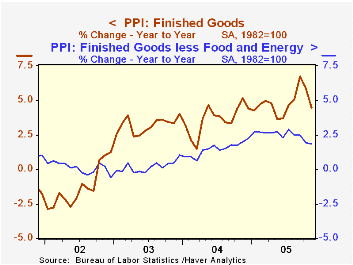
"Core" producer prices edged up 0.1% following the prior month's 0.3% decline and the rise fell short of Consensus expectations for a 0.2% increase.
Prices of finished consumer goods less food & energy rose 0.2% (2.0% y/y) and the gain was driven by a 0.5% (3.7% y/y) surge in core consumer nondurable goods prices. Durable goods prices fell another 0.2% -0.2% y/y) on top of the 0.9% October decline led by passenger car prices which fell 0.8% (-3.2% y/y). Capital equipment prices fell for the third month in the last four led by a 0.8% (-4.1% y/y) decline in truck prices.
Intermediate goods prices reversed only some of the prior month's strength with a 1.2% decline. Core intermediate goods prices remained firm and rose 0.5% on top of two months of 1.2% gain.
Crude energy prices similarly remained firm. The 1.2% decline in the total only dented the strong gains during four months because core crude prices soared 5.4% led by an 18.8% (-14.4% y/y) surge in iron & steel scrap prices. During the last thirty years "core" crude prices have been a fair indicator of industrial sector activity with a 48% correlation between the six month change in core crude prices and the change in factory sector industrial production.
Inflation Targeting under Commitment and Discretion from the Federal Reserve Bank of San Francisco can be found here.
| Producer Price Index | Nov | Oct | Y/Y | 2004 | 2003 | 2002 |
|---|---|---|---|---|---|---|
| Finished Goods | -0.7% | 0.7% | 4.5% | 3.6% | 3.2% | -1.3% |
| Core | 0.1% | -0.3% | 1.8% | 1.5% | 0.2% | 0.1% |
| Intermediate Goods | -1.2% | 3.0% | 8.4% | 6.6% | 4.6% | -1.5% |
| Core | 0.5% | 1.2% | 4.5% | 5.7% | 2.0% | -0.5% |
| Crude Goods | -1.2% | 6.7% | 20.8% | 17.5% | 25.1% | -10.6% |
| Core | 5.4% | -1.2% | 3.1% | 26.6% | 12.4% | 3.8% |

Tom Moeller
AuthorMore in Author Profile »Prior to joining Haver Analytics in 2000, Mr. Moeller worked as the Economist at Chancellor Capital Management from 1985 to 1999. There, he developed comprehensive economic forecasts and interpreted economic data for equity and fixed income portfolio managers. Also at Chancellor, Mr. Moeller worked as an equity analyst and was responsible for researching and rating companies in the economically sensitive automobile and housing industries for investment in Chancellor’s equity portfolio. Prior to joining Chancellor, Mr. Moeller was an Economist at Citibank from 1979 to 1984. He also analyzed pricing behavior in the metals industry for the Council on Wage and Price Stability in Washington, D.C. In 1999, Mr. Moeller received the award for most accurate forecast from the Forecasters' Club of New York. From 1990 to 1992 he was President of the New York Association for Business Economists. Mr. Moeller earned an M.B.A. in Finance from Fordham University, where he graduated in 1987. He holds a Bachelor of Arts in Economics from George Washington University.
More Economy in Brief


