Global| Oct 15 2009
Philadelphia Fed Index Slips Yet Still Indicates Positive Growth
by:Tom Moeller
|in:Economy in Brief
Summary
October index of factory sector activity from the Philadelphia Federal Reserve Bank indicated that activity in the region continued to grow this month. The index slipped as expected to a positive 11.5 from 14.1 in September and [...]
 October
index of factory sector activity from the Philadelphia Federal Reserve
Bank indicated that activity in the region continued to grow this
month. The index slipped as expected to a positive 11.5 from 14.1 in
September and remained near its highest since mid-2007. The latest
level compared to figures near -40.0 this past fall and winter.
October
index of factory sector activity from the Philadelphia Federal Reserve
Bank indicated that activity in the region continued to grow this
month. The index slipped as expected to a positive 11.5 from 14.1 in
September and remained near its highest since mid-2007. The latest
level compared to figures near -40.0 this past fall and winter.
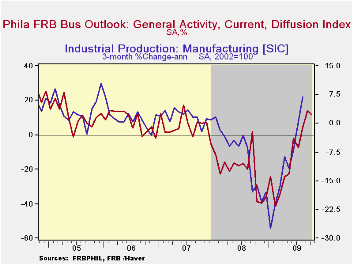
During
the last ten years there has been a 77% correlation between the level
of the Philadelphia Fed Business Conditions Index and the three-month
growth in factory sector industrial production.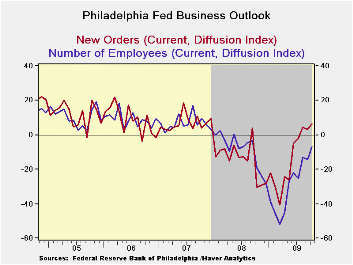 There has been a 70%
correlation with q/q growth in real GDP. The latest survey from the
Philadelphia Federal Reserve Bank can be found here.·
Amongst the components, new orders improved to 6.2 from 3.3 and the
latest figure was the highest since 2007. Also showing improvement was
the employment index. It rose to a still negative -6.8 but that
compared with a low of -52.0 during March. During the last ten years
there has been a 79% correlation between the index level and the m/m
change in manufacturing sector payrolls. The inventory component
reversed its earlier improvement and suggests that any turn towards
inventory accumulation will be modest.
There has been a 70%
correlation with q/q growth in real GDP. The latest survey from the
Philadelphia Federal Reserve Bank can be found here.·
Amongst the components, new orders improved to 6.2 from 3.3 and the
latest figure was the highest since 2007. Also showing improvement was
the employment index. It rose to a still negative -6.8 but that
compared with a low of -52.0 during March. During the last ten years
there has been a 79% correlation between the index level and the m/m
change in manufacturing sector payrolls. The inventory component
reversed its earlier improvement and suggests that any turn towards
inventory accumulation will be modest.
Improved pricing power
accompanied the gains in real activity. The prices paid index rose to
its highest level since last September and compares to negative
readings this past winter and spring. During the last ten years there
has been a 74% correlation between the prices paid index and the
three-month growth in the intermediate goods PPI.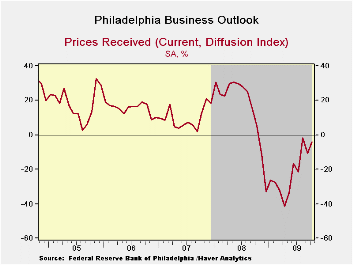 There has been an 83%
correlation with the change in core intermediate goods prices.
There has been an 83%
correlation with the change in core intermediate goods prices.
Expected business conditions in six months fell this month. The October index fell to a still-positive reading of 39.8 but that was down from the recent high. Most of the index components fell except anticipated capital expenditures.· The figures from the Philadelphia Federal Reserve can be found in Haver's SURVEYS database.
| Philadelphia Fed (%) | October | September | October '08 | 2008 | 2007 | 2006 |
|---|---|---|---|---|---|---|
| General Activity Index | 11.5 | 14.1 | -38.7 | -21.3 | 5.0 | 8.0 |
| New Orders | 6.2 | 3.3 | -30.6 | -14.7 | 6.9 | 9.0 |
| Number of Employees | -6.8 | -14.3 | -19.2 | -8.7 | 6.8 | 9.0 |
| Prices Paid Index | 21.3 | 14.9 | 10.2 | 36.4 | 26.3 | 36.7 |

Tom Moeller
AuthorMore in Author Profile »Prior to joining Haver Analytics in 2000, Mr. Moeller worked as the Economist at Chancellor Capital Management from 1985 to 1999. There, he developed comprehensive economic forecasts and interpreted economic data for equity and fixed income portfolio managers. Also at Chancellor, Mr. Moeller worked as an equity analyst and was responsible for researching and rating companies in the economically sensitive automobile and housing industries for investment in Chancellor’s equity portfolio. Prior to joining Chancellor, Mr. Moeller was an Economist at Citibank from 1979 to 1984. He also analyzed pricing behavior in the metals industry for the Council on Wage and Price Stability in Washington, D.C. In 1999, Mr. Moeller received the award for most accurate forecast from the Forecasters' Club of New York. From 1990 to 1992 he was President of the New York Association for Business Economists. Mr. Moeller earned an M.B.A. in Finance from Fordham University, where he graduated in 1987. He holds a Bachelor of Arts in Economics from George Washington University.
More Economy in Brief