 Global| Jun 17 2005
Philadelphia Fed Index Negative
by:Tom Moeller
|in:Economy in Brief
Summary
The Index of General Business Conditions in the manufacturing sector from the Philadelphia Fed went negative in June for the first month in just over two years. The 9.5 point m/m decline to -2.2 added to declines earlier this year [...]
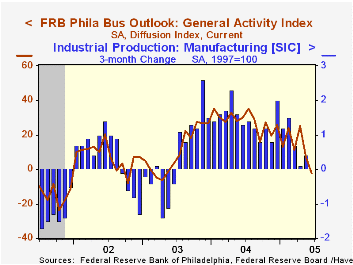
The Index of General Business Conditions in the manufacturing sector from the Philadelphia Fed went negative in June for the first month in just over two years. The 9.5 point m/m decline to -2.2 added to declines earlier this year which have lowered the index 27.6 points since December. Consensus expectations had been for a positive reading of 10.0 in June.
During the last ten years there has been a 68% correlation between the level of the Philadelphia Fed Business Conditions Index and three month growth in factory sector industrial production. There has been a 50% correlation with q/q growth in real GDP.
The new orders index dropped 12.5 points to the lowest level in two years and shipments also fell hard to 6.6 versus a high near 40 about one year ago. The index covering the number of employees rose slightly to 7.1 but that is down versus last year's high of 22.9. During the last ten years there has been a 64% correlation between the employment index and the three month growth in factory payrolls.
The business conditions index reflects a separate survey question, not the sub indexes.
The separate index of expected business conditions in six months improved versus a downwardly revised May level.
The prices paid index fell sharply for the second month and at 23.5 is down 43 points from the January high. During the last ten years there has been a 75% correlation between the prices paid index and the three month growth in the intermediate goods PPI. The correlation with the finished goods PPI has been 50% and with the CPI it's been 43%.
The Philadelphia Fed index is based on a survey of 250 regional manufacturing firms, but these firms sell nationally and internationally.
The latest Business Outlook survey from the Philadelphia Federal Reserve Bank can be found here.
| Philadelphia Fed Business Outlook | June | May | June '04 | 2004 | 2003 | 2002 |
|---|---|---|---|---|---|---|
| General Activity Index | -2.2 | 7.3 | 30.0 | 28.1 | 10.6 | 7.7 |
| Prices Paid Index | 23.5 | 30.9 | 50.8 | 51.3 | 16.8 | 12.3 |
by Tom Moeller June 17, 2005
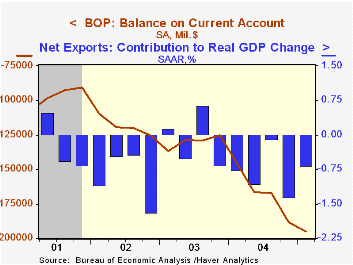
The 1Q05 US current account deficit deepened to another record of $195.1B, or 6.4% of GDP. Consensus expectations had been for a deficit of $189.0B. Trade account deterioration was estimated to have subtracted 0.7 percentage points from 1Q growth in real GDP, an estimate which may be increased. Earlier estimates of the current account deficit were deepened slightly for 2004.
The deficit in merchandise trade deteriorated to $186.3B from a revised $182.2B in 4Q. Exports grew 2.4% (10.3% y/y) and imports rose 2.3% (15.9% y/y).
The surplus on services improved for the second consecutive quarter to $14.6B, the highest level since 4Q03 but remained down from the annual peak in 1997 of $89.8B. Exports of services grew 4.3% in 1Q (12.7% y/y and imports rose 2.9% (12.1% y/y).
From the capital account, US foreign direct investment abroad dropped sharply to $32.2B following a 4Q surge while foreign direct investment in the US slipped to $28.8B.
| US Int'l Balance of Payments | 1Q '05 | 4Q '04 | Y/Y | 2004 | 2003 | 2002 |
|---|---|---|---|---|---|---|
| Current Account Deficit | $195.1B | $188.4B | $146.1B | $668.1B | $519.7B | $475.2B |
| Goods/Services/Income Deficit | $168.0B | $166.0B | $123.8B | $587.1B | $448.5B | $411.2B |
| Exports | 2.1% | 5.0% | 13.8% | 14.9% | 6.8% | -3.7% |
| Imports | 1.9% | 6.3% | 19.4% | 18.1% | 7.3% | 1.6% |
| Unilateral Transfers Deficit | $27.1B | $22.4B | $22.3B | $80.9B | $71.2B | $64.0B |
by Tom Moeller June 17, 2005
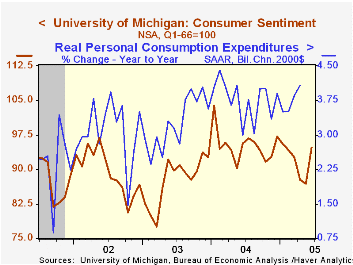
The University of Michigan's preliminary reading of consumer sentiment in June improved a sharp 9.1% versus May to 94.8. Sentiment rose to the highest level since January. Consensus expectations had been for a level of 88.7.
During the last ten years there has been a 74% correlation between the level of consumer sentiment and the y/y change in real PCE, although the correlation has fallen in recent years.
Consumer expectations surged a sharp 12.6% following five months of decline.
The reading of current economic conditions also rose 5.2% to the highest level since January.
The University of Michigan survey is not seasonally adjusted.The mid-month survey is based on telephone interviews with 250 households nationwide on personal finances and business and buying conditions. The survey is expanded to a total of 500 interviews at month end.
| University of Michigan | June | May | Y/Y | 2004 | 2003 | 2002 |
|---|---|---|---|---|---|---|
| Consumer Sentiment | 94.8 | 86.9 | -0.8% | 95.2 | 87.6 | 89.6 |
| Current Conditions | 110.4 | 104.9 | 3.5% | 105.6 | 97.2 | 97.5 |
| Consumer Expectations | 84.8 | 75.3 | -4.2% | 88.5 | 81.4 | 84.6 |
by Carol Stone June 17, 2005
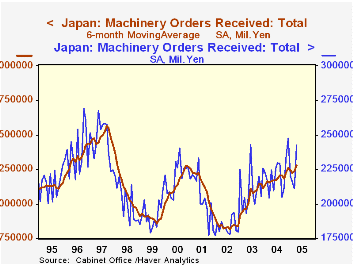
Orders received by Japan's machinery industry rebounded sharply in April, according to data reported yesterday and today by the Japanese Cabinet Office. Total orders, seasonally adjusted, were up 14.8% in the month, after three successive declines. These order flows are very erratic, as seen in the chart, and we have plotted a 6-month moving average to show the trend. This measure increased 2.2% from March. April orders were 8.3% ahead of April 2004.
A broad division of these orders into domestic and foreign sources indicates that Japanese industry is still led by external demand. Foreign orders were up 31.3% in April and 18.3% over a year ago. These have a loose negative correlation with the value of the yen, as might be expected (see second graph). And while the yen has strengthened against the dollar (and therefore against the Chinese yuan), it has remained weak relative to the euro, at least until very recently. Taking account other currencies as well, a weighted "effective" exchange rate published by the Bank of Japan has been basically flat for the last three years, and therefore largely a neutral force on total foreign demand for Japanese products.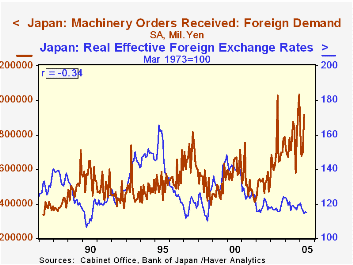
Domestic orders are creeping upward. Machinery orders from private non-manufacturing industries are also basically flat. However, manufacturing industry orders for machines are rising. This sector was up 14.4% in April alone, reaching ¥511 billion, the largest single month since May 1997. These orders are volatile, too, and such a jump and level are likely unsustainable in the near term. Even so, this sign of firmer domestic demand in Japan is encouraging.
| Japan(Billion ¥) | Apr 2005 | Mar 2005 | Year Ago (Yr/Yr) | Monthly Averages|||
|---|---|---|---|---|---|---|
| 2004 | 2003 | 2002 | ||||
| Total Orders* | 2,421.6 | 2,109.5 | 2,243.7 | 2,202.7 | 2,113.1 | 1,836.7 |
| % Change | 14.8 | -2.4 | 8.3 | 4.2 | 15.0 | -10.9 |
| Domestic | 1,380.4 | 1,320.5 | 1,347.0 | 1,323.5 | 1,295.6 | 1,217.5 |
| % Change | 4.5 | -4.7 | 2.6 | 2.2 | 6.4 | -14.8 |
| Foreign | 915.0 | 696.9 | 781.4 | 770.4 | 708.4 | 521.5 |
| % Change | 31.3 | 2.9 | 18.1 | 8.8 | 35.9 | -0.7 |

Tom Moeller
AuthorMore in Author Profile »Prior to joining Haver Analytics in 2000, Mr. Moeller worked as the Economist at Chancellor Capital Management from 1985 to 1999. There, he developed comprehensive economic forecasts and interpreted economic data for equity and fixed income portfolio managers. Also at Chancellor, Mr. Moeller worked as an equity analyst and was responsible for researching and rating companies in the economically sensitive automobile and housing industries for investment in Chancellor’s equity portfolio. Prior to joining Chancellor, Mr. Moeller was an Economist at Citibank from 1979 to 1984. He also analyzed pricing behavior in the metals industry for the Council on Wage and Price Stability in Washington, D.C. In 1999, Mr. Moeller received the award for most accurate forecast from the Forecasters' Club of New York. From 1990 to 1992 he was President of the New York Association for Business Economists. Mr. Moeller earned an M.B.A. in Finance from Fordham University, where he graduated in 1987. He holds a Bachelor of Arts in Economics from George Washington University.
More Economy in Brief


