 Global| Jul 18 2002
Philadelphia Fed Index Fell
by:Tom Moeller
|in:Economy in Brief
Summary
The Philadelphia Feds index of general business conditions for July fell quite a bit more than expected following an outsized June gain. New and unfilled orders fell sharply along with shipments. Delivery lead times shortened [...]
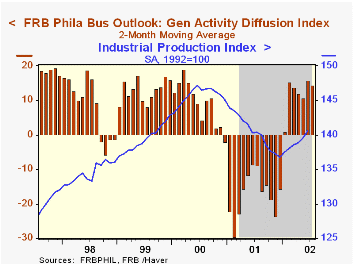
The Philadelphia Fed’s index of general business conditions for July fell quite a bit more than expected following an outsized June gain.
New and unfilled orders fell sharply along with shipments. Delivery lead times shortened substantially.
The business conditions index reflects a separate survey question, not the components.
Pricing pressure fell moderately, the first monthly easing since last October. The pricing index level nevertheless remained elevated.
| Philadelphia Fed Business Outlook | July | June | Y/Y | 2001 | 2000 | 1999 |
|---|---|---|---|---|---|---|
| General Activity Index | 6.6 | 22.2 | -12.4 | -17.3 | 8.2 | 13.3 |
| Prices Paid Index | 17.9 | 22.9 | -5.0 | -1.0 | 27.1 | 10.0 |
by Tom Moeller July 18, 2002
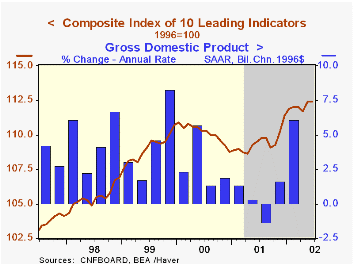
The Composite Index of Leading Economic Indicators was unchanged last month, as expected. The May gain was revised up.
The ratio of coincident to lagging indicators rose for the eighth month in nine. The ratio is an indication that excesses in the economy are falling relative to the economy's actual performance.
The coincident indicators index was at the same level in June as in January 2001. The lagging indicators fell 7.0% during that period.
60% of the leaders' component series rose last month versus 70% that rose in May. Longer hours worked, a decline in claims for jobless insurance, a rise in the money supply and improved vendor performance had the largest positive influence.
The Leading index is based on eight previously reported economic data series and two that are estimated.
| Business Cycle Indicators | June | May | Y/Y | 2001 | 2000 | 1999 |
|---|---|---|---|---|---|---|
| Leading | 0.0% | 0.6% | 2.6% | -0.6% | 1.0% | 3.3% |
| Coincident | 0.3% | 0.1% | 0.3% | 0.3% | 3.4% | 3.2% |
| Lagging | -0.1% | -0.1% | -5.1% | -1.3% | 2.8% | 1.8% |
by Tom Moeller July 18, 2002
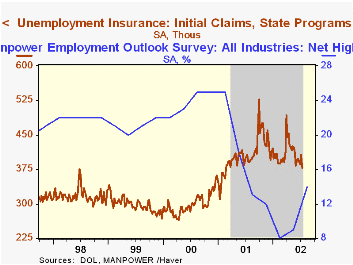
Initial claims for unemployment insurance fell more than expected in the latest week. Claims were their lowest since February of last year. The prior week's level was revised up slightly.
The claims figure is for the July nonfarm payroll survey period. Initial claims were down about 20,000 from the June survey period.
Continuing claims for unemployment insurance fell slightly but the prior week's level was revised down sharply. Continuing claims are down 6.3% from the peak in early May.
The four-week moving average of initial claims fell to 391,000, -1.6% y/y.
The insured rate of unemployment was unchanged at 2.8%.
| Unemployment Insurance (000s) | 7/13/02 | 7/6/02 | Y/Y | 2001 | 2000 | 1999 |
|---|---|---|---|---|---|---|
| Initial Claims | 379.0 | 407.0 | 6.4% | 405.8 | 299.8 | 297.7 |
| Continuing Claims | -- | 3,591 | 17.5% | 3,021 | 2,114 | 2,186 |

Tom Moeller
AuthorMore in Author Profile »Prior to joining Haver Analytics in 2000, Mr. Moeller worked as the Economist at Chancellor Capital Management from 1985 to 1999. There, he developed comprehensive economic forecasts and interpreted economic data for equity and fixed income portfolio managers. Also at Chancellor, Mr. Moeller worked as an equity analyst and was responsible for researching and rating companies in the economically sensitive automobile and housing industries for investment in Chancellor’s equity portfolio. Prior to joining Chancellor, Mr. Moeller was an Economist at Citibank from 1979 to 1984. He also analyzed pricing behavior in the metals industry for the Council on Wage and Price Stability in Washington, D.C. In 1999, Mr. Moeller received the award for most accurate forecast from the Forecasters' Club of New York. From 1990 to 1992 he was President of the New York Association for Business Economists. Mr. Moeller earned an M.B.A. in Finance from Fordham University, where he graduated in 1987. He holds a Bachelor of Arts in Economics from George Washington University.
More Economy in Brief


