 Global| Oct 01 2010
Personal Income Boosted By Jobless Insurance Payouts
by:Tom Moeller
|in:Economy in Brief
Summary
Personal income firmed during August and posted a 0.5% gain following an unrevised 0.2% July increase. The increase beat Consensus expectations for a 0.3% gain.However, rather than reflecting some broad-based improvement in earnings, [...]
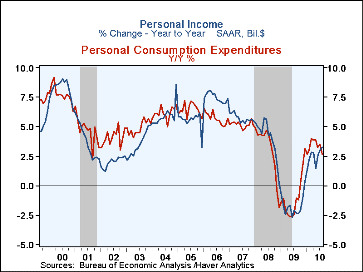 Personal income firmed during August and posted a 0.5% gain following an unrevised 0.2% July increase.
The increase beat Consensus expectations for a 0.3% gain.However, rather than reflecting some broad-based
improvement in earnings, it was mostly limited to those receiving unemployment benefits. These surged 21.9% m/m
(-2.5% y/y) due to the latest extension of jobless insurance payouts.Continuing modest were wages & salaries which rose
0.3% (1.9% y/y) after a 0.4% July gain. Much of last month's moderation was due to a 0.4% decline (+1.1% y/y) in government
sector wages. Disposable income rose the same 0.5% as overall income.Adjusted for price inflation, take-home pay rose 0.2%
(1.7% y/y).
Personal consumption expenditures rose 0.4%, the same as during July; and on a three-month basis, spending growth improved to 3.1%(AR).A 0.3% August spending increase had been expected.Regrettably, most of the pickup reflects higher gasoline prices.Adjusted for inflation, spending rose just 0.2% during each of the last two months and at a stable 1.8% rate during the last three.Since May, real services spending rose at a 1.3% rate.For goods, real spending growth picked up to 2.7% owing to a 10.3% rise in recreation.
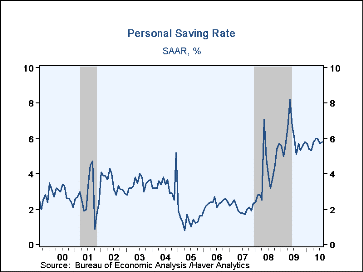
Moderate gains in income coupled with moderate spending can mean only one thing for savings -- stability.The personal savings rate ticked up to 5.8% from a downwardly revised 5.7% in July.The latest roughly equals the level for all of last year though it does remain up from the 1.8% low during the fall of 2007.
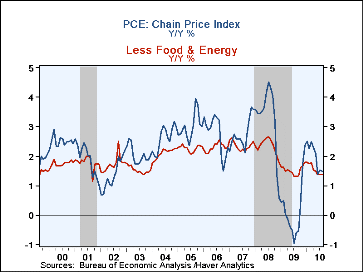
The PCE chain price index again rose a moderate 0.2% during August.These increases followed three months of decline. A 3.6% increase (5.2% y/y) in gasoline prices roughly equaled the July gain. Food & beverage prices ticked up 0.1%(0.7% y/y) but that's up from declines early this year.The core PCE price deflator ticked up just 0.1% for the fourth consecutive month and y/y growth of 1.4% was nearly its weakest since the 1960s.
The personal income & consumption figures are available in Haver's USECON and USNA databases.
Yesterday's speech by Fed Chairman Ben S.Bernanke can be found here
| Disposition of Personal Income (%) | August | July | June | Y/Y | 2009 | 2008 | 2007 |
|---|---|---|---|---|---|---|---|
| Personal Income | 0.5 | 0.2 | 0.0 | 3.3 | -1.7 | 4.0 | 5.7 |
| Wages & Salaries | 0.3 | 0.4 | -0.1 | 1.9 | -4.3 | 2.1 | 5.8 |
| Disposable Personal Income | 0.5 | 0.1 | 0.0 | 3.2 | 0.7 | 5.1 | 5.1 |
| Personal Consumption Expenditures | 0.4 | 0.4 | -0.0 | 2.7 | -1.0 | 3.0 | 5.2 |
| Saving Rate | 5.8 | 5.7 | 6.0 | 5.1 (Aug. '09) | 5.9 | 4.1 | 2.1 |
| PCE Chain Price Index | 0.2 | 0.2 | -0.1 | 1.5 | 0.2 | 3.3 | 2.7 |
| Less food & energy | 0.1 | 0.1 | 0.1 | 1.4 | 1.5 | 2.3 | 2.4 |
Tom Moeller
AuthorMore in Author Profile »Prior to joining Haver Analytics in 2000, Mr. Moeller worked as the Economist at Chancellor Capital Management from 1985 to 1999. There, he developed comprehensive economic forecasts and interpreted economic data for equity and fixed income portfolio managers. Also at Chancellor, Mr. Moeller worked as an equity analyst and was responsible for researching and rating companies in the economically sensitive automobile and housing industries for investment in Chancellor’s equity portfolio. Prior to joining Chancellor, Mr. Moeller was an Economist at Citibank from 1979 to 1984. He also analyzed pricing behavior in the metals industry for the Council on Wage and Price Stability in Washington, D.C. In 1999, Mr. Moeller received the award for most accurate forecast from the Forecasters' Club of New York. From 1990 to 1992 he was President of the New York Association for Business Economists. Mr. Moeller earned an M.B.A. in Finance from Fordham University, where he graduated in 1987. He holds a Bachelor of Arts in Economics from George Washington University.


