 Global| May 26 2009
Orders in Near Collapse then (Negative) Growth Rates Stabilize
Summary
Order trends have deteriorated for both EMU domestic and foreign orders but each series also shows signs of a turn. Three month rates of growth are not as bad as six month rates of growth although six month rates of growth are worse [...]
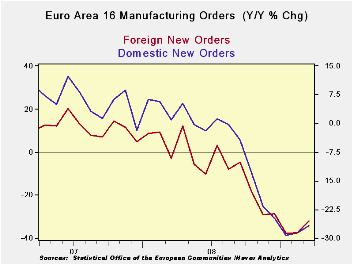 Order trends have
deteriorated for both EMU domestic and
foreign orders but each series also shows signs of a turn. Three month
rates of growth are not as bad as six month rates of growth although
six month rates of growth are worse than Yr/Yr rates of growth.
February had posted some positive rates of growth for EMU in the month.
Those turned negative in March. But that has been enough to blunt the
slide in the growth rates. Still it is not a picture of growth, rather
it’s a hint of putting the worst behind us – a rather common theme by
now.
Order trends have
deteriorated for both EMU domestic and
foreign orders but each series also shows signs of a turn. Three month
rates of growth are not as bad as six month rates of growth although
six month rates of growth are worse than Yr/Yr rates of growth.
February had posted some positive rates of growth for EMU in the month.
Those turned negative in March. But that has been enough to blunt the
slide in the growth rates. Still it is not a picture of growth, rather
it’s a hint of putting the worst behind us – a rather common theme by
now.
We can also learn something of the EMU situation from the new
details released on German GDP in 2009-Q1
German GDP was rocked in 2009-Q1 by a huge pullback in capital
spending a flow that receded at a 50% annual rate. Exports shrank at a
stunning 34% annual rate and imports fell at nearly a 20% annual rate
(buffering the slide in GDP). The theme of weak investment was extended
by housing where investment fell at a comparatively tepid 10% pace. The
weakness in capital formation spending dropped domestic demand at
nearly a 6.8% annual rate.
Over the past year GDP fell by nearly 7%, a huge Yr/Yr drop,
led by capital formation and export weakness. In the quarter consumer
spending rose but over one year it is lower by just a tick. Germany’s
weakness is not a product of consumer weakness. And with strong social
welfare spending programs the likelihood of keeping a spillover to the
consumer in check is good.
Germany, an important exporting nation, clearly it is
importing a great deal of its weakness from abroad. In that respect it
is encouraging that Germany has seen its orders jump by 3% in March.
That hardly means that the episode of weakness in over. But it suggests
that forces that will put an end to contraction may be in train. That
is just another version of the same story that things are better than
they were but not yet showing growth. Still that is the nature of
recessions as they turn to recovery. You have to look for a gradual
cessation of the slowing and a switch to a period of what will probably
appear to be sporadic growth which then could develop more vigor. We
are now just at the cusp where the declines in growth slow and we only
seen a few scattered signs of growth. We are a ways from seeing
consistent growth and any sort of strength.
| Euro Area 16 and UK Industrial Orders | |||||||||
|---|---|---|---|---|---|---|---|---|---|
| Saar except m/m | Mo/Mo | Mar-09 | Feb-09 | Mar-09 | Feb-09 | Mar-09 | Feb-09 | ||
| Euro Area Overview | Mar-09 | Feb-09 | Jan-09 | 3-Mo | 3-Mo | 6-mo | 6-mo | 12-mo | 12-mo |
| Total Orders | -0.8% | 0.0% | -2.0% | -11.0% | -38.8% | -44.5% | -48.4% | -31.3% | -32.0% |
| E-16 Domestic MFG orders | -1.5% | 0.8% | -1.2% | -7.2% | -30.3% | -38.6% | -44.9% | -26.8% | -28.5% |
| E-16 Foreign MFG orders | -0.4% | 1.1% | -7.2% | -23.5% | -42.4% | -48.2% | -49.8% | -32.0% | -37.3% |
| Countries: | Mar-09 | Feb-09 | Jan-09 | 3-Mo | 3-Mo | 6-mo | 6-mo | 12-mo | 12-mo |
| Germany (MFG): | 3.3% | -3.3% | -8.0% | -28.8% | -55.2% | -47.4% | -58.1% | -34.5% | -37.5% |
| France (Ind): | -6.7% | 6.7% | -2.5% | -11.3% | 13.8% | -33.7% | -27.9% | -23.9% | -23.2% |
| Italy (Ind): | -2.7% | -2.1% | -3.9% | -29.6% | -27.5% | -39.8% | -39.4% | -29.8% | -31.2% |
| UK (Engineering Ind): | -1.1% | 17.3% | -32.5% | -62.5% | -3.0% | -48.6% | -16.0% | -14.6% | -23.3% |
| German GDP | ||||||||
|---|---|---|---|---|---|---|---|---|
| Consumption | Capital Formation | Domestic | ||||||
| GDP | Private | Public | Total | Housing | Exports | Imports | Demand | |
| % change Q/Q; X-M is Q/Q change in Blns of euros | ||||||||
| Q1-09 | -14.4% | 1.8% | 1.0% | -50.7% | -9.9% | -33.4% | -19.8% | -6.8% |
| Q4-08 | -8.6% | -1.1% | -0.3% | -18.3% | -5.0% | -28.6% | -15.4% | -0.2% |
| Q3-08 | -2.1% | 1.0% | 0.5% | 1.1% | -0.6% | -1.6% | 17.0% | 5.6% |
| Q2-08 | -2.0% | -2.0% | 2.0% | 2.3% | -13.4% | -0.8% | -6.9% | -4.7% |
| % change Yr/Yr; X-M is Yr/Yr change in Gap in Blns of euros | ||||||||
| Q1-09 | -6.9% | -0.1% | 0.8% | -19.7% | -7.3% | -17.5% | -7.3% | -1.6% |
| Q4-08 | -1.8% | -0.6% | 1.5% | -2.4% | 0.3% | -6.3% | 1.2% | 1.9% |
| Q3-08 | 0.8% | -0.4% | 1.9% | 6.5% | 2.0% | 3.2% | 5.2% | 1.5% |
| Q2-08 | 2.0% | -0.4% | 2.1% | 7.8% | 2.8% | 5.4% | 3.9% | 1.1% |
| 5-Yrs | 0.3% | 0.2% | 1.0% | 2.3% | -0.2% | 3.2% | 4.7% | 0.7% |

Robert Brusca
AuthorMore in Author Profile »Robert A. Brusca is Chief Economist of Fact and Opinion Economics, a consulting firm he founded in Manhattan. He has been an economist on Wall Street for over 25 years. He has visited central banking and large institutional clients in over 30 countries in his career as an economist. Mr. Brusca was a Divisional Research Chief at the Federal Reserve Bank of NY (Chief of the International Financial markets Division), a Fed Watcher at Irving Trust and Chief Economist at Nikko Securities International. He is widely quoted and appears in various media. Mr. Brusca holds an MA and Ph.D. in economics from Michigan State University and a BA in Economics from the University of Michigan. His research pursues his strong interests in non aligned policy economics as well as international economics. FAO Economics’ research targets investors to assist them in making better investment decisions in stocks, bonds and in a variety of international assets. The company does not manage money and has no conflicts in giving economic advice.
More Economy in Brief


