 Global| Feb 14 2011
OECD LEIs Advance but Slow
Summary
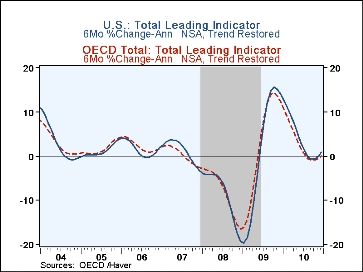
The US economy and the OECD remain on roughly the same path. The trend restored leading indicators from the OECD show that from 2008 onward, there has been a severe down-phase, and a strong up-phase that has since played out and now a [...]
 The US economy and the OECD remain on roughly the same path. The trend restored leading indicators from the OECD show that
from 2008 onward, there has been a severe down-phase, and a strong up-phase that has since played out and now a small upturn that
hints at continued expansion. The OECD leading indicators for all of the OECD area, for the main seven OECD nations, for Japan and for
the US all are positive in their December month-to-month signals. Japan’s positive result is heartening in the wake of its reported Q4 GDP decline.
Still the deceleration in the various OECD metrics are clear cut. Yet, that is not surprising after such a boom to encounter a pronounced period of deceleration but it then must segue way into a period of expansion again. This one at least hints at doing that.
Beyond the LEI metrics the ordinary economic data suggest that the transition to sustained growth appears to be in train. While the events in Egypt and the Middle East, and the debt issues that still are unresolved in Europe, the slowdown in China and spike in commodity prices all hover and pose certain challenges to continued expansion, in the main, data continue to press ahead and point to growth.
The six-month trend adjusted LEIs represent the way that the OECD likes to look at its indicators. On this basis the OECD area is coming off a boom (the 6-mo indicators of 12-mos ago) then they slowed sharply (the 6-Mo gain from 6-months ago) and have since slowed to crawl (the most recent six month gain). Japan’s indicators have leveled out at about 2% growth on those horizons while the US economy has continued to step down its readings.
But in the current month we see the various OED measures coming back to life and posting accelerations over their November values. On balance, the OECD data are consistent with the expansion enduring but they are not strong indicators in any particular direction at the moment.
| OECD Trend-restored leading Indicators | ||||||
|---|---|---|---|---|---|---|
| Growth:M/M | Growth Progression-SAAR | |||||
| Dec-10 | Nov-10 | 3Mo | 6Mo | 12Mo | Yr-Ago | |
| OECD | 0.1% | 0.1% | 1.2% | 0.1% | 0.9% | 8.1% |
| OECD7 | 0.2% | 0.1% | 1.3% | -0.2% | 0.6% | 7.7% |
| OECD.Japan | 0.4% | 0.3% | 3.9% | 1.9% | 2.0% | 3.3% |
| OECD US | 0.3% | 0.2% | 2.7% | 0.9% | 1.9% | 7.8% |
| Six Months | Six Month Readings at 6Mo Intervals: | |||||
| Change in 6M Avg | Recent six | 6Mo Ago | 12Mo Ago | 18Mo Ago | ||
| OECD | -0.2% | -0.1% | 0.1% | 1.7% | 12.2% | 4.2% |
| OECD7 | -0.5% | -0.4% | -0.2% | 1.4% | 12.8% | 2.9% |
| OECD.Japan | 0.2% | 0.2% | 1.9% | 2.1% | 11.6% | -4.4% |
| OECD US | 0.0% | 0.2% | 0.9% | 3.0% | 14.0% | 2.1% |
| Slowdowns indicated by BOLD RED | ||||||
Robert Brusca
AuthorMore in Author Profile »Robert A. Brusca is Chief Economist of Fact and Opinion Economics, a consulting firm he founded in Manhattan. He has been an economist on Wall Street for over 25 years. He has visited central banking and large institutional clients in over 30 countries in his career as an economist. Mr. Brusca was a Divisional Research Chief at the Federal Reserve Bank of NY (Chief of the International Financial markets Division), a Fed Watcher at Irving Trust and Chief Economist at Nikko Securities International. He is widely quoted and appears in various media. Mr. Brusca holds an MA and Ph.D. in economics from Michigan State University and a BA in Economics from the University of Michigan. His research pursues his strong interests in non aligned policy economics as well as international economics. FAO Economics’ research targets investors to assist them in making better investment decisions in stocks, bonds and in a variety of international assets. The company does not manage money and has no conflicts in giving economic advice.
More Economy in Brief
 Global| Feb 05 2026
Charts of the Week: Balanced Policy, Resilient Data and AI Narratives
by:Andrew Cates


