 Global| Nov 13 2012
OECD Leading Indicators
Summary
The Composite Leading Indicators of the OECD (Organization for Economic Cooperation and Development) were published today. Besides the official 34 member countries from Europe, North and South America, Australia, New Zealand, and [...]
 The Composite Leading Indicators of the OECD (Organization for Economic Cooperation and Development) were published
today. Besides the official 34 member countries from Europe, North
and South America, Australia, New Zealand, and Israel data are given for the
transition economies: Brazil, India, Indonesia, Russia, China and
South Africa.
The indicators are designed to catch turning points
in economic activity. They are based on economic series that tend to be
early movers in the business cycle. The individual series are
subject to a number of tests and then are combined into a single
series--the Composite Leading Indicator. The OECD also provides a
monthly series of GDP against which the economic indicator can be
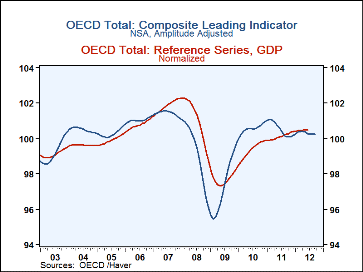
charted. The attached chart shows the Leading indicator for the 34
members together with the GDP for these countries. The leading index
does indeed lead the changes of direction in the GDP reference
series. The leading indicators for July, August and September
are forecasting declines for these months in the total GDP of the OECD
member countries.
There is, however a great deal of diversity among the countries. As can be seen in the table below, the leading indicators in the US, Canada and China are holding steady while the leading indicators in Brazil, the UK and Ireland are showing signs of picking up, and those in Germany, France and Japan are worsening.
| OECD Leading Indicators | Sep | Aug | Jul | Jun | May | Apr | Mar | Feb | Jan |
|---|---|---|---|---|---|---|---|---|---|
| Steady | |||||||||
| United States | 100.90 | 100.80 | 100.77 | 100.79 | 100.86 | 100.91 | 100.91 | 100.84 | 100.68 |
| Canada | 99.70 | 99.67 | 99.69 | 99.69 | 99.74 | 99.77 | 99.77 | 99.75 | 99.72 |
| China | 99.43 | 99.43 | 99.43 | 99.44 | 99.49 | 99.57 | 99.71 | 99.83 | 99.93 |
| Picking Up | |||||||||
| Brazil | 99.51 | 99.44 | 99.36 | 99.23 | 99.09 | 98.94 | 99.73 | 99.49 | 99.24 |
| UK | 100.24 | 100.06 | 99.89 | 99.75. | 99.65 | 99.58 | 99.51 | 99.42 | 99.32 |
| Ireland | 101.17 | 101.11 | 101.11 | 100.97 | 100.93 | 100.88 | 100.77 | 100.61 | 100.39 |
| Worsening | |||||||||
| Germany | 98.70 | 98.96 | 99.24 | 99.52 | 99.75 | 91.98 | 99.98 | 99.98 | 99.94 |
| France | 99.50 | 99.56 | 99.62 | 99.67 | 99.71 | 99.75 | 99.80 | 99.85 | 99.92 |
| Japan | 100.18 | 100.27 | 100.38 | 100.51 | 100.65 | 100.75 | 100.81 | 100.79 | 100.72 |
More Economy in Brief
 Global| Feb 05 2026
Charts of the Week: Balanced Policy, Resilient Data and AI Narratives
by:Andrew Cates


