 Global| Dec 11 2006
OECD Leaders Up Again
by:Tom Moeller
|in:Economy in Brief
Summary
For October, the Leading Index of the major 7 OECD economies rose 0.2% after an unrevised 0.4% increase during September. It was the third increase following three consecutive months of decline and the index's six month growth rate [...]
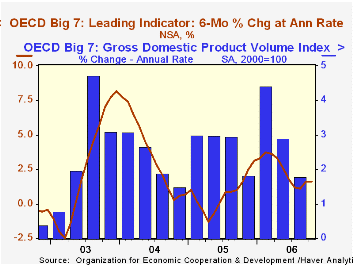
For October, the Leading Index of the major 7 OECD economies rose 0.2% after an unrevised 0.4% increase during September. It was the third increase following three consecutive months of decline and the index's six month growth rate held at 1.6%.
During the last ten years there has been a 64% correlation between the change in the leading index and the q/q change in the GDP Volume Index for the Big Seven OECD countries.
The U.S. leading indicators increased just 0.1% after a downwardly revised 0.6% September rise. It was the third consecutive monthly increase after four months of decline. The index's six month growth rate slipped m/m to 1.9%, down from growth above 4% at the beginning of the year. Higher stock prices and improved consumer sentiment accounted for most of the recent gains. They offset lower construction starts and a more negative interest rate spread. The correlation between the leaders' growth rate and U.S. real GDP growth has been a high 73% during the last ten years.
Modern Macroeconomics in Practice: How Theory is Shaping Policy, from the Federal Reserve Bank of Minneapolis, is available here.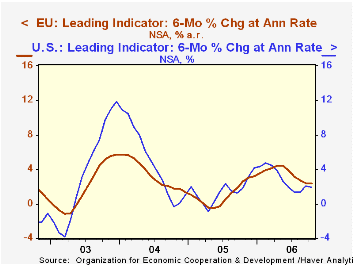
The Canadian leaders jumped 0.9% following a 0.7% September increase that was very much upwardly revised. The leaders' six month growth rate consequently rose to 5.3%, its best since early 2004, due to higher share prices in Toronto. The correlation of the leaders' growth with Canadian real GDP has been 49% during the last ten years.
The leading index for the European Union (15 countries) rose 0.3% after two 0.1% increases. The modest gains dropped the index's six month growth rate to 2.4%, the same as last month but own from 4% growth earlier in the year. During the last ten years there has been a 59% correlation between the change in the leading index and the quarterly change in the European Union GDP volume index.
The German leading index posted a firm 0.5% increase last month after four consecutive 0.1% gains. That leveled the six month growth rate at 4.0%, roughly half its earlier growth. During the last ten years there has been a 32% correlation between the change in the German leading index and the quarterly change in GDP volume. The business climate and export orders have improved but the tendency of orders inflow deteriorated.
A tenth consecutive monthly increase was logged in France. The 0.2% October increase left the series' six month growth rate steady at 2.6%. During the last ten years there has been a 54% correlation between the leaders' growth rate and growth in France's real GDP. Consumer confidence continued to improve along with industrial sector prospects and share prices, but new car registrations fell.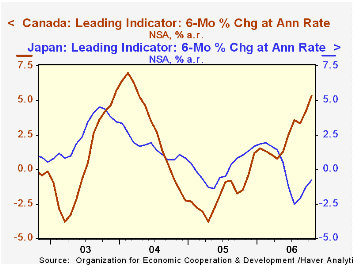
The Italian leading index fell for the fourth consecutive month. The 0.2% decline lowered the series' six month growth rate to a more negative -0.9%. Much higher short term interest rates have offset improvement in many component series.
The leading index in Japan rose for the third consecutive month following five months of decline. The gains improved the index's six month growth rate to a still-negative -0.8%. Dwellings started and share prices are up but interest rate spreads have fallen. The leaders' correlation with Japan's real economic growth has been a meaningful 41% during the last ten years.
The UK leaders rose a modest 0.2% in October but the paucity of recent gains left the six month growth rate stable at a low 1.3%. During the last ten years there has been a 36% correlation between the leaders' growth rate and U.K. real GDP growth.
The latest OECD Leading Indicator report can be found here.
Technology Capital and the U.S. Current Account Deficit, also from the Federal Reserve Bank of Minneapolis, can be found here.
| OECD | October | September | Y/Y | 2005 | 2004 | 2003 |
|---|---|---|---|---|---|---|
| Composite Leading Index | 105.94 | 105.71 | 2.3% | 103.05 | 102.53 | 97.98 |
| 6 Month Growth Rate | 1.6% | 1.6% | -- | 0.7% | 3.6% | 2.6% |
by Louise Curley December 11, 2006
Germany released data today for the third quarter balance of payments on a seasonally adjusted basis and for the month of October on a seasonally unadjusted basis. Late last week monthly data on total trade and trade in goods were released for October and trade by major product groupings and by broad country groupings were released for September.
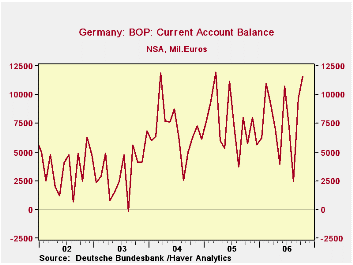
On a seasonally unadjusted basis, Germany's current account surplus rose to 11,573 million euros in October from 9,682 in September and was 5,803 million euros above October 2005. The seasonally unadjusted data are erratic, but as the first chart shows, the October surplus is a near record. The recent rise in the surplus has been due, in part, to a sharp decline in the year to year declines in energy imports as the price of oil has fallen. The second chart shows the year over year changes in millions of euros in total imports and in energy imports.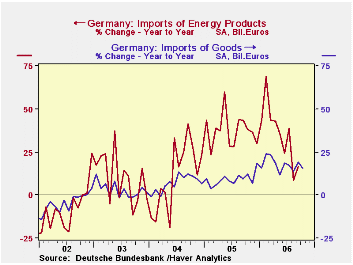
Another feature of Germany's improved balance of good has been the relatively greater increase in trade with non European countries than with European countries. This is notable in view of the slow down in the United States. The third chart compares the year to year percentage changes in exports to Other Europe and Non Europe.
On a quarterly, seasonally adjusted bases, the current account for the third quarter was 1,930 million euros below the second quarter and 580 million euros below the third quarter of 2005. The strength of the rise in the current account surplus for October suggests that the fourth quarter current account may show an improvement in the current account on a quarterly basis.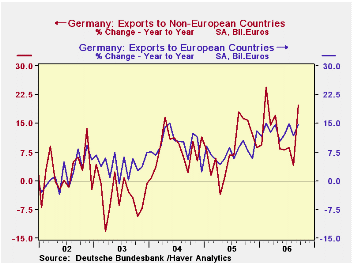
| GERMANY (million of euros) |
Q3 06 | Q2 06 | Q3 05 | Q/Q dif | Y/Y dif | 2005 dif | 2004 dif | 2003 dif |
|---|---|---|---|---|---|---|---|---|
| Current Account (SA) | 22,990 | 24,920 | 23,990 | -1,930 | -580 | 9,800 | 39,660 | -1,420 |
| Exports to Other Europe | 167.56 | 161.05 | 147.22 | 4.04* | 13.28* | 7.64* | 9.5* | 4.14* |
| Exports to Non Europe | 58.80 | 54.51 | 53.06 | 7.89* | 10.82* | 7.99* | 8.07* | -3.82* |
| Imports from Other Europe | 131.38 | 128.10 | 112.62 | 2.56* | 16.66* | 879* | 5.42* | 3.15* |
| Imports from Other Europe | 55.69 | 50.65 | 47.53 | 9.95* | 17.17* | 10.59* | 10.69* | 2.60* |
| Oct 06 | Sep 06 | Oct 05 | M/M dif | Y/Y dif | 2005 dif | 2004 dif | 2003 dif | |
| Current Account (NSA) | 11,573 | 9682 | 5,769 | 1,891 | 5,803 | 8,345 | 41,636 | -3,084 |
| Balance on Goods | 17,296 | 15,674 | 11,788 | 1,621 | 5,508 | 2,886 | 26,175 | -2,867 |
| Exports | 84,070 | 79,457 | 68,592 | 4,613 | 15,478 | 54,722 | 67,089 | 13,134 |
| Imports | 66,774 | 63,783 | 56,804 | 2,991 | 9,970 | 52,639 | 40,914 | 16,002 |

Tom Moeller
AuthorMore in Author Profile »Prior to joining Haver Analytics in 2000, Mr. Moeller worked as the Economist at Chancellor Capital Management from 1985 to 1999. There, he developed comprehensive economic forecasts and interpreted economic data for equity and fixed income portfolio managers. Also at Chancellor, Mr. Moeller worked as an equity analyst and was responsible for researching and rating companies in the economically sensitive automobile and housing industries for investment in Chancellor’s equity portfolio. Prior to joining Chancellor, Mr. Moeller was an Economist at Citibank from 1979 to 1984. He also analyzed pricing behavior in the metals industry for the Council on Wage and Price Stability in Washington, D.C. In 1999, Mr. Moeller received the award for most accurate forecast from the Forecasters' Club of New York. From 1990 to 1992 he was President of the New York Association for Business Economists. Mr. Moeller earned an M.B.A. in Finance from Fordham University, where he graduated in 1987. He holds a Bachelor of Arts in Economics from George Washington University.
More Economy in Brief


