 Global| Dec 15 2004
OECD Leaders Declined For Third Month
by:Tom Moeller
|in:Economy in Brief
Summary
In October, the Index of Leading Indicators for the Major Seven OECD Countries fell slightly for the third straight month. The declines pulled the six-month growth rate down to 0.4%, its lowest since May 2003. During the last ten [...]
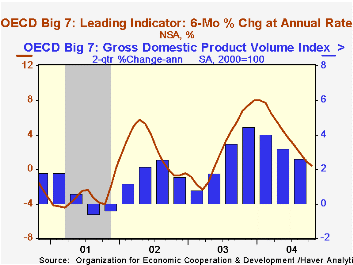
In October, the Index of Leading Indicators for the Major Seven OECD Countries fell slightly for the third straight month. The declines pulled the six-month growth rate down to 0.4%, its lowest since May 2003.
During the last ten years there has been a 77% correlation between the leaders' growth rate and the two quarter change in the GDP Volume Index for the Big 7 countries in the OECD.
The leading index in Japan turned negative for the third straight month, with six-month growth falling to -1.5% There has been a 45% correlation during the last ten years between the leaders and real GDP growth in Japan. Net foreign trade has contributed significantly to the leaders' deterioration.
The leaders for the United States fell for the third straight month and six month growth fell to just 0.2% with a tighter yield curve, lower consumer sentiment & a lower business climate indicator offsetting other component gains.
The leading index growth rate for the European Union has held up well relative to other countries, with gains logged during the last four months, though six-month growth fell to 2.5% from a peak of 6.2% late last year. Growth in the German leaders fell to 2.0% in October versus 8.3% in January as a result of a tighter yield curve and a slower orders inflow. Leaders in Italy improved some with the six-month growth rate slightly positive after several months negative; the decline in consumer confidence stabilized. In France, the leading index growth rate decelerated to 3.7% versus 8.2% at the start of the year and growth in the UK leaders improved to 1.1% after two months negative during the summer.
In Canada the leaders went further negative with a tighter yield curve.
Visit the OECD at this website.
| OECD Main Economic Indicators | Oct | Sept | 6-Mth Chg | 2003 | 2002 | 2001 |
|---|---|---|---|---|---|---|
| OECD Major Seven - Leading Index (Trend Restored) | 102.0 | 102.1 | 0.4% | 2.6% | 2.3% | -3.2% |
| European Union | 106.1 | 105.8 | 2.5% | 2.3% | 3.5% | -2.5% |
| Japan | 97.4 | 97.7 | -1.5% | 1.9% | 0.5% | -4.4% |
| United States | 102.4 | 102.5 | 0.2% | 3.7% | 2.0% | -3.3% |

Tom Moeller
AuthorMore in Author Profile »Prior to joining Haver Analytics in 2000, Mr. Moeller worked as the Economist at Chancellor Capital Management from 1985 to 1999. There, he developed comprehensive economic forecasts and interpreted economic data for equity and fixed income portfolio managers. Also at Chancellor, Mr. Moeller worked as an equity analyst and was responsible for researching and rating companies in the economically sensitive automobile and housing industries for investment in Chancellor’s equity portfolio. Prior to joining Chancellor, Mr. Moeller was an Economist at Citibank from 1979 to 1984. He also analyzed pricing behavior in the metals industry for the Council on Wage and Price Stability in Washington, D.C. In 1999, Mr. Moeller received the award for most accurate forecast from the Forecasters' Club of New York. From 1990 to 1992 he was President of the New York Association for Business Economists. Mr. Moeller earned an M.B.A. in Finance from Fordham University, where he graduated in 1987. He holds a Bachelor of Arts in Economics from George Washington University.
More Economy in Brief


