 Global| Dec 19 2006
November PPI Gain the Largest Since 1974
by:Tom Moeller
|in:Economy in Brief
Summary
The producer price index for finished goods surged 2.0% last month and far surpassed Consensus expectations for a 0.6% rise. It was the largest one month increase since 1974 and reflected higher energy & nonenergy prices. The core PPI [...]
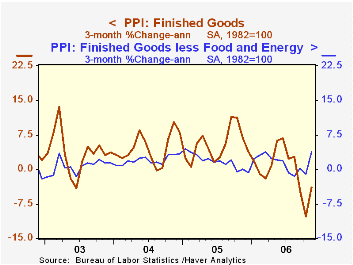
The producer price index for finished goods surged 2.0% last month and far surpassed Consensus expectations for a 0.6% rise. It was the largest one month increase since 1974 and reflected higher energy & nonenergy prices. The core PPI jumped a surprising 1.3% and easily beat Consensus expectations for a 0.2% uptick with the largest m/m increase since 1980.
Finished energy goods prices recovered all of the prior month's decline with a 6.1% (-1.8% y/y) increase. Gasoline prices jumped 17.9% (3.5% y/y) after three months of sharp decline and fuel oil prices surged 7.7% (6.1% y/y). Natural gas prices also recovered most of their October drop with a 5.9% (-14.1% y/y) increase.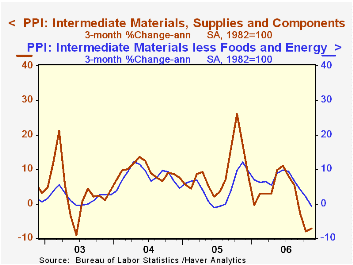
Finished consumer goods prices less food & energy jumped 1.1% (1.7% y/y) after the 0.8% October decline and the rise was led by a 2.2% (-0.7% y/y) increase in passenger cars. Furniture prices rose 0.2% (2.5% y/y) for the second month.
The 1.4% (2.2% y/y) surge in capital equipment prices followed a 0.9% October decline and reflected a 13.6% (0.7% y/y) recovery in light truck prices which had plunged 9.7% during the prior month.
Intermediate goods prices increased 0.7% but prices less food & energy fell 0.3% reflecting a huge 4.4% (+12.2% y/y) decline in steel mill products prices.
The crude materials PPI recovered all of the prior months decline with a 15.7% surge as natural gas prices nearly doubled m/m (-35.1% y/y). Plywood & timber prices surged 5.0% (7.5% y/y) and aluminum base scrap rose 2.7% (28.8% y/y).
| Producer Price Index | November | October | Y/Y | 2005 | 2004 | 2003 |
|---|---|---|---|---|---|---|
| Finished Goods | 2.0% | -1.6% | 0.9% | 4.9% | 3.6% | 3.2% |
| Core | 1.3% | -0.9% | 1.8% | 2.4% | 1.5% | 0.2% |
| Intermediate Goods | 0.7% | -1.1% | 2.6% | 8.0% | 6.6% | 4.7% |
| Core | -0.3% | 0.0% | 5.1% | 5.5% | 5.7% | 2.0% |
| Crude Goods | 15.7% | -10.5% | -8.5% | 14.6% | 17.5% | 25.1% |
| Core | 0.5% | -1.3% | 17.8% | 4.8% | 26.5% | 12.4% |

Tom Moeller
AuthorMore in Author Profile »Prior to joining Haver Analytics in 2000, Mr. Moeller worked as the Economist at Chancellor Capital Management from 1985 to 1999. There, he developed comprehensive economic forecasts and interpreted economic data for equity and fixed income portfolio managers. Also at Chancellor, Mr. Moeller worked as an equity analyst and was responsible for researching and rating companies in the economically sensitive automobile and housing industries for investment in Chancellor’s equity portfolio. Prior to joining Chancellor, Mr. Moeller was an Economist at Citibank from 1979 to 1984. He also analyzed pricing behavior in the metals industry for the Council on Wage and Price Stability in Washington, D.C. In 1999, Mr. Moeller received the award for most accurate forecast from the Forecasters' Club of New York. From 1990 to 1992 he was President of the New York Association for Business Economists. Mr. Moeller earned an M.B.A. in Finance from Fordham University, where he graduated in 1987. He holds a Bachelor of Arts in Economics from George Washington University.
More Economy in Brief


