 Global| Aug 27 2009
Money Supplies Surge...Or Do They?
Summary
The chart exhibits growth rates for money presented in national currency terms for several key countries. The table produces the same data with some different horizons for calculation. In the chart’s lower panel, the various series [...]
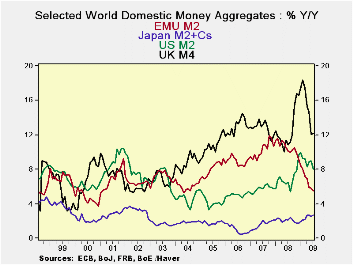
The chart exhibits growth rates for money presented in
national currency terms for several key countries. The table produces
the same data with some different horizons for calculation. In the
chart’s lower panel, the various series are inflation-adjusted (real
balances).
Monetary expansions looks too strong - The
picture on Yr/Yr money growth is a bit frightening. Japan’s growth rate
for M2 plus CD’s, its preferred monetary measure, is at 2.7% and is
quite contained. EMU’s rate at 5.5% seems high for its current growth
state. At 8.1% and 12% respectively the US and the UK seem to have
flooded their respective markets with liquidity. And in some ways they
have.
Or is it decelerating too much? But if you
turn your attention to the table instead of the chart you see a second
phenomenon is in play. Money growth rates are and have been
decelerating greatly from 12-months to 6-months and from 6-months to
3-months. In addition we provide some credit measures for EMU and they
have the same properties.
Weak once inflation adjusted - Next if we
turn to the lower panel of the chart to focus on the inflation adjusted
flows there, we find a marked deceleration is in place and that
monetary growth appears to be much less aggressive than it seems on the
broader 12-month horizon and in a nominal framework.
EMU - In EMU 3-Month growth rates for
money are at 2% while credit to residents is rising in real terms at a
1% rate and loans are shrinking by nearly 1% in real terms.
US and UK: Despite double-digit 12-month
growth rates in both the US and the UK each has real money balances
shrinking over three months.
Japan: Only Japan has relatively stable
nominal rates of growth for money and a slightly expanded growth rate
for real money balances over three months.
Policy confusion: All this just adds to the
confusion about policy. Is it tight or is it loose? Is it as loose as
it seems over 12 months or is it being tightened too rapidly as the
3-month trend seems to say? What about extracting ourselves from this
overtly stimulative period? Is there inflation risk and can the central
banks handle it?
Crosscurrents -On balance we see lots of
opinions but few good ways to make a clear discriminating argument. We
prefer to point out that the situation is complicated and in flux. We
urge investors to weigh the issues and we believe that where you come
down on the central bank issue depends on if you have trust in the
central bank/bankers or not. We do not think that the data are very
clear or that any course of action is baked in the cake. We see the
excessive money growth followed by some too-hard squeezing as evidence
that the central bankers are managing the risks – or trying to do so.
After all, the Yr/Yr money supplies are bloated but that is what the
bankers did to help blunt the crisis. It is in the past. To balance
that we do not see explosive sequential growth rates for money, quite
the opposite. We do not think this is a coincidence. Just as we are
monitoring these flows, so the central bankers are monitoring the
economy and the monetary trends. The data in the table are good
remainders to be careful about only looking at Yr/Yr growth rates. That
Yr/Yr growth in US and UK money supplies looks a lot different when you
shorten the growth horizon and deflate the flows to adjust for the
effects of inflation.
| Look at Global and Euro Liquidity Trends | |||||||
|---|---|---|---|---|---|---|---|
| Saar-all | Euro Measures (E13): Money & Credit | G-10 Major Markets: Money | Memo | ||||
| €€-Supply M2 | Credit: Residents |
Loans | $US M2 | ££UK M4 | ¥¥Jpn M2+Cds | OIL:WTI | |
| 3-MO | 1.8% | 0.6% | -1.1% | 3.2% | 3.1% | 2.7% | 171.5% |
| 6-MO | 2.7% | -0.8% | -1.9% | 2.7% | 2.4% | 3.4% | 136.3% |
| 12-MO | 5.5% | 3.0% | 0.9% | 8.1% | 12.1% | 2.7% | -52.0% |
| 2-Yr | 7.8% | 7.0% | 5.1% | 7.3% | 11.5% | 2.4% | -6.6% |
| 3-Yr | 8.8% | 8.4% | 6.9% | 6.8% | 12.1% | 2.3% | -4.7% |
| Real Balances: deflated by Own CPI. Oil deflated by US CPI | |||||||
| 3-MO | 2.0% | 0.9% | -0.8% | -0.2% | -0.6% | 5.1% | 162.5% |
| 6-MO | 2.5% | -1.0% | -2.1% | 0.5% | -0.9% | 4.7% | 131.3% |
| 12-MO | 6.2% | 3.7% | 1.6% | 10.1% | 10.2% | 4.9% | -51.1% |
| 2-Yr | 6.1% | 5.3% | 3.3% | 5.5% | 8.2% | 2.4% | -8.2% |
| 3-Yr | 7.0% | 6.6% | 5.1% | 4.8% | 9.2% | 2.3% | -6.5% |
| Japan CPI for July is an estimate; it uses the June value to produce the real balance figure | |||||||

Robert Brusca
AuthorMore in Author Profile »Robert A. Brusca is Chief Economist of Fact and Opinion Economics, a consulting firm he founded in Manhattan. He has been an economist on Wall Street for over 25 years. He has visited central banking and large institutional clients in over 30 countries in his career as an economist. Mr. Brusca was a Divisional Research Chief at the Federal Reserve Bank of NY (Chief of the International Financial markets Division), a Fed Watcher at Irving Trust and Chief Economist at Nikko Securities International. He is widely quoted and appears in various media. Mr. Brusca holds an MA and Ph.D. in economics from Michigan State University and a BA in Economics from the University of Michigan. His research pursues his strong interests in non aligned policy economics as well as international economics. FAO Economics’ research targets investors to assist them in making better investment decisions in stocks, bonds and in a variety of international assets. The company does not manage money and has no conflicts in giving economic advice.
More Economy in Brief


