 Global| Apr 25 2008
Michigan Consumer Sentiment Lowest Since 1982
by:Tom Moeller
|in:Economy in Brief
Summary
The final April reading of consumer sentiment from the University of Michigan fell 9.9% m/m to 62.6, a bit more than the 9.1% decline in the preliminary figure. The drop was larger than Consensus expectations and it reduced the level [...]
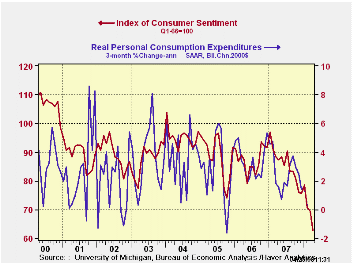
The final April reading of consumer sentiment from the University of Michigan fell 9.9% m/m to 62.6, a bit more than the 9.1% decline in the preliminary figure. The drop was larger than Consensus expectations and it reduced the level of sentiment to the lowest level since 1982.
The current conditions index within overall consumer sentiment
was weaker than indicated in the preliminary report. It fell 8.6% m/m
after a slight rise during March. The view of current conditions for
buying large household goods fell a hard 9.7% (-26.3% y/y) and the view
of current personal finances fell a somewhat lesser 7.5% (-27.7%
y/y).The view of current buying conditions for large household goods
fell 25.7% y/y and 11% of respondents thought that prices were too
high, nearly the largest percentage since late 1996. 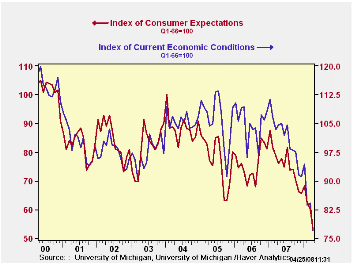
The expectations component of overall sentiment still accounted for the larger part of the April decline with an 11.3% m/m drop. The index fell to its lowest level since late 1990. Expectations for personal finances fell a sharp 10.7% m/m (-21.3% y/y). Expectations for business conditions during the next year fell an even sharper 13.0% (-54.0% y/y) and expectations for conditions over the next five years fell 12.3% m/m (-21.1% y/y).
Opinions about government policy, which apparently influence
economic expectations, fell 5.9% m/m (-29.7% y/y) which was an even
deeper decline than in the preliminary report. The percentage of those
surveyed who indicated that they thought government was doing a good
job fell to 7%, the lowest level since 1991 while 43% indicated that
they thought government was doing a poor job.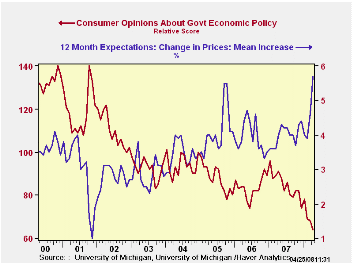
The mean expected rate of inflation during the next twelve months rose further to 5.7%, the highest level since 1990.Has the Behavior of Inflation and Long-Term Inflation Expectations Changed? from the Federal Reserve Bank of Kansas City can be found here.
The University of Michigan survey is not seasonally adjusted.The reading is based on telephone interviews with about 500 households at month-end; the mid-month results are based on about 300 interviews. The summary indexes are in Haver's USECON database, with details in the proprietary UMSCA database.
PCE and CPI Inflation Differential: Converting Inflation Forecasts also from the Federal Reserve Bank of Kansas City is available here.
| University of Michigan | April (Final) | April (Prelim.) | March | Feb | April y/y | 2007 | 2006 | 2005 |
|---|---|---|---|---|---|---|---|---|
| Consumer Sentiment | 62.6 | 63.2 | 69.5 | 70.8 | -28.1% | 85.6 | 87.3 | 88.5 |
| Current Conditions | 77.0 | 78.4 | 84.2 | 83.8 | -26.4% | 101.2 | 105.1 | 105.9 |
| Expectations | 53.3 | 53.4 | 60.1 | 62.4 | -29.8% | 75.6 | 75.9 | 77.4 |
by Robert Brusca April 25, 2008
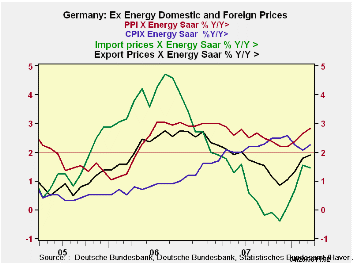
I don’t expect the ECB to declare inflation victory based on this German external price report. But, German ex energy prices are coalescing around the 2% level. That’s not headline inflation. And the result is for Germany not EMU and Germany consistently has one of the very best inflation records in EMU. So while the German figures show signs of inflation coming into line, we can expect figures for the Euro Area as a whole to fall short of this progress.
Even for Germany there remain question marks on inflation. Three month export and import headline price trends are, respectively at 4.5% and 6.7% over thee months, at 3% and 8.5% over 6-months and at 2.2% and 5.9% over 12-months. The twelve month results while better are still an acceleration over the previous March of 2007 12-month period (marked as Yr-ago in the table).
Since the ex-petroleum indices are NSA so the sequential growth rates calculations are not to be relied on. There, the 12-mnth growth in ex petrol export and import prices is at 1.9% and 1.5%, respectively: within ECB boundaries at least for an HICP headline rate.
But the actual German CPI headline rate is up by 3% yr/yr accelerating sharply from 1.9% over the previous March’s 12-month pace. Ex-energy the German CPI is up at a 2.3% pace, something the Fed in the US would be pleased with but it’s still accelerating from 1.7% in the 12-month period ending in March of 2007. While the ECB may look at ex-food and ex petrol HICP measures, its standard is for headline inflation alone and that is running ‘wild’ in the ECB’s mind. Still, the sequential growth rates for Germany’s overall and core CPI (which are based on seasonally adjusted data) are actually showing diminishing pressures.
The German PPI and its core remain rogue. The same inflation twist is at work in the US, but the US CPI report continues to perform well at least for Core inflation. Wholesale prices place a greater weight on raw goods. At a time of spiking commodity prices, that’s going to be a problem. Consumer goods industries use industrial prices as an input but have another stage of processing and therefore have another chance for productivity to keep price trends in check.
The German figures, while not up to the ECB’s lofty standards are nonetheless showing a lot of progress especially for a period with such repeated and strong commodity price shocks. One hopes that behind closed doors the ECB is really more pleased than what it reveals in its public comments.
Europe still has some inflation to fight. The situation in the UK seems to be worse than in the Euro Area. But the ECB seems to have matters more under control especially with the strong euro to help. The German price trends aren’t perfect but there are some good things in train there. As Euro Area economies are getting weaker maybe ECB rhetoric can tone down its concerns a notch or two – okay, maybe a half-notch or so….
| German International and Domestic Inflation Trends | |||||||
|---|---|---|---|---|---|---|---|
| % m/m | % Saar | ||||||
| SA: | Mar-08 | Feb-08 | Jan-08 | 3-Mo | 6-Mo | 12-Mo | Yr-Ago |
| Export Prices | 0.1% | 0.5% | 0.6% | 4.5% | 3.0% | 2.2% | 2.1% |
| Import Prices | 0.0% | 0.9% | 0.7% | 6.7% | 8.5% | 5.9% | 0.8% |
| NSA | |||||||
| Exports excl Petroleum | 0.2% | 0.6% | 0.7% | 5.8% | 2.6% | 1.9% | 2.2% |
| Imports excl Petroleum | 0.0% | 0.9% | 0.9% | 7.2% | 3.7% | 1.5% | 1.9% |
| Memo: SA | |||||||
| CPI | 0.4% | 0.1% | 0.2% | 2.7% | 3.5% | 3.0% | 1.9% |
| CPI excl Energy | 0.3% | 0.0% | 0.1% | 1.5% | 2.3% | 2.3% | 1.7% |
| PPI | 0.5% | 0.6% | 0.5% | 6.4% | 6.5% | 4.2% | 2.5% |
| PPI excl Energy | 0.4% | 0.4% | 0.4% | 4.7% | 3.1% | 2.8% | 3.0% |

Tom Moeller
AuthorMore in Author Profile »Prior to joining Haver Analytics in 2000, Mr. Moeller worked as the Economist at Chancellor Capital Management from 1985 to 1999. There, he developed comprehensive economic forecasts and interpreted economic data for equity and fixed income portfolio managers. Also at Chancellor, Mr. Moeller worked as an equity analyst and was responsible for researching and rating companies in the economically sensitive automobile and housing industries for investment in Chancellor’s equity portfolio. Prior to joining Chancellor, Mr. Moeller was an Economist at Citibank from 1979 to 1984. He also analyzed pricing behavior in the metals industry for the Council on Wage and Price Stability in Washington, D.C. In 1999, Mr. Moeller received the award for most accurate forecast from the Forecasters' Club of New York. From 1990 to 1992 he was President of the New York Association for Business Economists. Mr. Moeller earned an M.B.A. in Finance from Fordham University, where he graduated in 1987. He holds a Bachelor of Arts in Economics from George Washington University.
More Economy in Brief


