 Global| Oct 24 2008
Lower Prices Spurred U.S. Existing Home Sales
by:Tom Moeller
|in:Economy in Brief
Summary
The level of September existing homes jumped 5.5% from August to 5.180 million, according to the National Association of Realtors. The rise followed an unrevised 2.2% August decline and beat Consensus expectations for a selling rate [...]
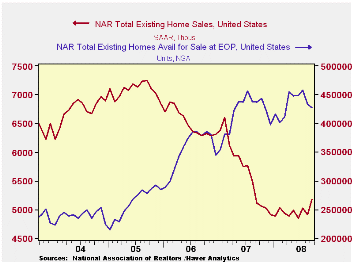
The level of September existing homes jumped 5.5% from August to 5.180 million, according to the National Association of Realtors. The rise followed an unrevised 2.2% August decline and beat Consensus expectations for a selling rate of 4.95M homes. Total sales include sales of condos and co-ops.
Median home prices fell 5.7% (NSA) last month for the third consecutive monthly drop. That pulled the y/y comparison to -9.0%. Prices have fallen 16.7% since their peak in April 2007.
Sales of existing single-family homes rose 6.2% after an unrevised 1.4% August decline. The y/y gains in both total sales and sales of single family homes turned positive for the first time since November 2005. Sales of existing homes, nonetheless, are down by one-third from their peak in mid-2005.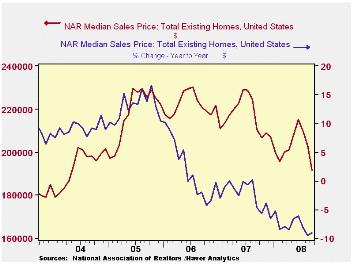
By region, home sales in the West led last month's increase with a 16.8% m/m gain. That lifted sales by more than one third versus the year ago level. Sales in the Midwest also rose but by a lesser 4.4%; the y/y change is still a negative 2.5%. In the South rose 2.2% (-7.8% y/y) but sales in the Northeast were off 1.2% (-7.7% y/y).
The number of unsold homes (condos & single-family) on the market fell 1.6% during September (-2.4% y/y) after a 5.2% August drop. At the current sales rate, the inventory fell to a 9.9 months supply versus the April peak of 11.2 months. For single-family homes, however, the inventory fell a bit more to a 9.4 months supply at the current sales rate, down from an 11.0 months supply in June.
Subprime Facts: What (We Think) We Know about the Subprime Crisis and What We Don’t from the Federal Reserve Bank of Boston is available here.
| Existing Home Sales (Thous) | September | y/y % | August | September '07 | 2007 | 2006 | 2005 |
|---|---|---|---|---|---|---|---|
| Total | 5,180 | 1.4 | 4,910 | 5,020 | 5,672 | 6,508 | 7,076 |
| Northeast | 840 | -7.7 | 850 | 910 | 1,008 | 1,090 | 1,168 |
| Midwest | 1,190 | -2.5 | 1,140 | 1,220 | 1,331 | 1,491 | 1,589 |
| South | 1,900 | -7.8 | 1,860 | 2,060 | 2,240 | 2,576 | 2,704 |
| West | 1,250 | 34.4 | 1,070 | 930 | 1,093 | 1,353 | 1,617 |
| Single-Family | 4,620 | 3.8 | 4,350 | 4,450 | 4,958 | 5,703 | 6,181 |
| Median Price, Total, $ | 191,600 | -9.0 | 203,100 | 210,500 | 216,617 | 222,000 | 218,217 |

Tom Moeller
AuthorMore in Author Profile »Prior to joining Haver Analytics in 2000, Mr. Moeller worked as the Economist at Chancellor Capital Management from 1985 to 1999. There, he developed comprehensive economic forecasts and interpreted economic data for equity and fixed income portfolio managers. Also at Chancellor, Mr. Moeller worked as an equity analyst and was responsible for researching and rating companies in the economically sensitive automobile and housing industries for investment in Chancellor’s equity portfolio. Prior to joining Chancellor, Mr. Moeller was an Economist at Citibank from 1979 to 1984. He also analyzed pricing behavior in the metals industry for the Council on Wage and Price Stability in Washington, D.C. In 1999, Mr. Moeller received the award for most accurate forecast from the Forecasters' Club of New York. From 1990 to 1992 he was President of the New York Association for Business Economists. Mr. Moeller earned an M.B.A. in Finance from Fordham University, where he graduated in 1987. He holds a Bachelor of Arts in Economics from George Washington University.
More Economy in Brief


