 Global| Aug 29 2006
Japanese Household's Living Expenditures
Summary
The Japanese Ministry of Internal Affairs and Communication publishes a variety of data relating to household's living expenditures as part of their report on the Family Income and Expenditure Survey. There are data on the actual [...]

The Japanese Ministry of Internal Affairs and Communication publishes a variety of data relating to household's living expenditures as part of their report on the Family Income and Expenditure Survey. There are data on the actual expenditures for all households and for workers' household. In addition to total expenditures, there are a number of spending categories.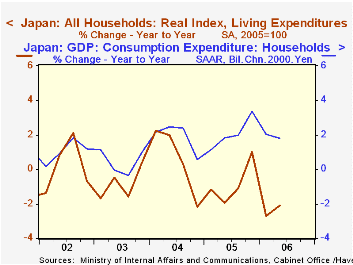 Data are given for "fundamental" and "selective" expenditures, what we would call nondiscretionary and discretionary spending. There are indexes--seasonally adjusted and not seasonally adjusted-- of the actual expenditures based on 2005=100. . Nominal and Real Indexes on a seasonally adjusted basis are available for all households, including agricultural, forestry and fisheries households and for all households excluding those households. Similar data for workers' households are also available. The data start in January 2000.
The monthly data have shown a slight downward trend over the past seven years as can be seen in the first chart that shows the year to year changes in the real and nominal indexes for workers' households. If the monthly data of the real index for living expenditures for all households including agriculture, forestry and fisheries households are aggregated to a quarterly basis, the quarterly data appear to show the same general movement as that shown by household consumption in the national accounts as can be seen in the second chart. Thus the living expenditure data appear to be coincident rather than leading indicators of total household consumption.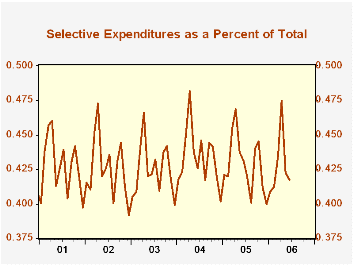
The data can be used to reveal spending patterns. For example, fundamental expenditures tend to take up between 52-58% of total spending while selected expenditures take up between 40-48% as shown in the third chart.
| Japan | Jul 06 | Jun 06 | May 05 | Apr 06 | Mar 06 | 2005 | 2004 | 2003 |
|---|---|---|---|---|---|---|---|---|
| Household Living Expenditures | ||||||||
| All Household (000 Yen) | 292.328 | 280.824 | 292.114 | 312.872 | 313.350 | -0.81 | 0.38 | -1.34 |
| Year/Year % Change | -0.83 | -1.12 | -1.24 | -1.56 | -1.87 | |||
| Workers' HHs (000 Yen) | 320.677 | 301.978 | 310.482 | 346.086 | 340.010 | -0.64 | 1.55 | -1.40 |
| Year/Year % Change | -1.46 | -2.29 | -2.10 | -3.88 | -3.77 | |||
| Workers' Households | ||||||||
| Real (2005=100) | 96.1 | 96.7 | 97.9 | 96.2 | 95.5 | -0.34 | 1.61 | -1.12 |
| Year/Year % Change | -1.74 | -2.91 | -2.30 | -3.90 | -3.34 | |||
| Nominal (2005=100) | 96.4 | 97.0 | 99.2 | 96.3 | 95.3 | -0.70 | 1.61 | -1.38 |
| Year/Year % Change | -1.23 | -2.41 | -2.19 | -4.08 | -3.74 |
More Economy in Brief


