 Global| Apr 28 2011
Japan's IP Takes a Big Hit
Summary
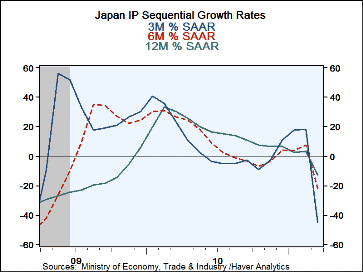
Japan's industrial production has taken a sharp move lower and posted the largest drop since the occupation. The data are for March; they complete the quarter and they reflect the partial effects of damage by the tsunami and [...]
 Japan's industrial production has taken a sharp move lower and posted the largest drop since the occupation. The data are for March;
they complete the quarter and they reflect the partial effects of damage by the tsunami and earthquakes that occurred in March.
The extent of the decline is worse than expected but a severe drop was anticipated. The sector results give us a look at the industries
that have been most affected by Japan's triple (earthquake, tsunami and nuclear) disasters.
The reductions in auto production and potential for credit downgrades to some Japanese auto-makers have put Japans auto sector in the spotlight in foreign markets. Now the industrial output data tell a grim story of Japan's vaunted auto sector being 'singled out' by the disaster as its output has fallen by more than output in any other sector. Transportation output fell by 49.2% in March, a gigantic drop. Textile output was relatively unaffected dropping only by 1.6% in March. Manufacturing as a whole receded by 15.3%.
By industry, consumer and goods output was hit hardest as it fell by 20.6% in the month. Intermediate and investment goods output fell on the order of 13%-14%. Utilities output declined by just 4% despite the fact that nuclear reactors were at the center of Japan's crisis. Mining output was seemingly unaffected as it continues to rise, gaining 0.5% in March as it rebounded from a drop of 3.7% in February.
For the quarter mining and MFG output is falling at a 7.5% annual rate; manufacturing alone is off at a 7.8% annual rate. Transportation in Q1 is off at a 27.3% annual rate.
The transportation sector is producing in March at a pace that is only 40% of the past cycle peak. Meanwhile all other industry groups are at 75% of their past cycle peaks or better.
The outlook is affected not just by the plants that have been decimated or damaged but also by the electricity shortage that will keep even potentially fully operational plants on short time. There is a battered infrastructure that needs to be repaired; there are ports that have been decimated or damaged and there is a loss of life and potentially a shortage of some skilled employees to contend with to rebuild. It will take some time to try and sort out the challenge that Japan must face up to. But Japan is a nation that is substantially homogenous and that does pull together and that should help it to surmount its difficulties. Unfortunately it is also a nation beset with great political chaos as it has been unable to put a leader in power that has been able to stay and to establish a policy direction for any substantial period of time. That issue could, to the contrary, delay Japan's rebuilding. Fortunately in Japan the various ministries are strong and they may be able to function in the absence of a strong central leadership but Japan's crisis and rebuilding challenge has many dimensions. Yet this is a country that in the past been able to rise up from great adversity.
| Japan Industrial Production Trends | |||||||||
|---|---|---|---|---|---|---|---|---|---|
| M/M % | SAAR % | Yr/Yr | Q-2-D % AR |
%of Cycle Peak |
|||||
| Seas Adj | Mar 11 |
Feb 11 |
Jan 11 |
3Mo | 6Mo | 12Mo | Yr Ago |
||
| Mining & MFG | -15.3% | 1.8% | 0.0% | -44.9% | -21.7% | -12.9% | 30.4% | -7.6% | 75.3% |
| Total Industry | -14.9% | 1.3% | 0.3% | -43.9% | -21.3% | -12.6% | 29.4% | -7.0% | 75.9% |
| MFG | -15.3% | 1.8% | -0.1% | -45.1% | -21.7% | -12.9% | 30.6% | -7.8% | 75.3% |
| Textiles | -1.6% | 1.4% | 2.1% | 7.9% | 3.2% | 2.7% | 2.1% | 14.1% | 79.9% |
| T-port | -49.2% | 5.1% | 3.2% | -90.8% | -69.5% | -50.6% | 85.4% | -27.3% | 40.8% |
| Product Group | |||||||||
| Consumer Gds | -20.6% | -0.5% | -5.4% | -68.9% | -43.8% | -25.3% | 21.2% | -35.5% | 66.2% |
| Intermediate Gds | -13.0% | 2.5% | 1.8% | -32.1% | -11.4% | -8.9% | 43.7% | 6.1% | 81.2% |
| Investment Gds | -14.4% | 2.6% | 1.6% | -36.7% | -18.1% | -7.3% | 15.4% | -3.7% | 72.0% |
| Mining | 0.5% | -3.7% | 15.0% | 53.3% | 16.9% | 1.4% | 0.4% | 67.9% | 88.9% |
| Electric & Gas | -4.0% | -2.1% | 5.8% | -2.0% | -6.8% | -2.4% | 7.5% | 12.1% | 92.0% |
Robert Brusca
AuthorMore in Author Profile »Robert A. Brusca is Chief Economist of Fact and Opinion Economics, a consulting firm he founded in Manhattan. He has been an economist on Wall Street for over 25 years. He has visited central banking and large institutional clients in over 30 countries in his career as an economist. Mr. Brusca was a Divisional Research Chief at the Federal Reserve Bank of NY (Chief of the International Financial markets Division), a Fed Watcher at Irving Trust and Chief Economist at Nikko Securities International. He is widely quoted and appears in various media. Mr. Brusca holds an MA and Ph.D. in economics from Michigan State University and a BA in Economics from the University of Michigan. His research pursues his strong interests in non aligned policy economics as well as international economics. FAO Economics’ research targets investors to assist them in making better investment decisions in stocks, bonds and in a variety of international assets. The company does not manage money and has no conflicts in giving economic advice.


