 Global| Jan 11 2011
Japan LEI Gains Some Traction
Summary
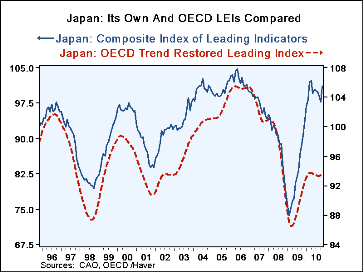
Japan's LEI has been gaining some traction. It shows a more complete recovery in gear than does the OECD LEI which has not rebounded as much in the last year or so as the Japanese national gauge. Japan's own LEI gauge shows a recent [...]
 Japan's LEI has been gaining some traction. It shows a more complete recovery in gear than does the OECD LEI which has not
rebounded as much in the last year or so as the Japanese national gauge. Japan's own LEI gauge shows a recent sharp surge higher.
Its 3-month growth rate has accelerated beyond its pace for six-months but still expands at a pace below its 12-month rate of growth
The components of the OECD LEI show that the movement in the loan to deposit ratio is still a negative in Japan as is the barometer for overtime hours in MFG. But the construction sector, the trade sector, the interest rate spread (yield curve), and stock index are all moving higher. Inventories are a positive in the outlook. In short while. Japan still has a lot of challenges including a huge debt load and political uncertainty number of indicators are turning positive.
Japan has even done its part to try and calm the European debt situation by promising to buy European securities. This pledge along with China's earlier steps have helped to restore some balance in a European trading day that was starting to get a bit ugly. It's a key week for the European markets with key bond offerings on tap and Japan has some done something to try and make it a successful one. On top of that it has posted some improved economic readings.
| Japan's LEI and its trends | |||||||
|---|---|---|---|---|---|---|---|
| Levels | Growth (SAAR) | ||||||
| Nov-10 | Oct-10 | Sep-10 | 3Mo | 6Mo | 12Mo | 24MO | |
| LEI | 101.0 | 97.7 | 99.1 | 4.9% | 2.8% | 11.2% | 24.7% |
| LEI: OECD | 93.6 | 93.4 | 93.4 | 1.0% | 0.0% | 1.9% | 2.1% |
| OECD LEI details | |||||||
| Share Prices | 99.8 | 99.7 | 99.6 | 0.8% | 0.0% | 0.6% | 1.8% |
| Int Spread (chngs) | 100.1 | 100.0 | 100.0 | 0.2 | 0.0 | 0.0 | 0.7 |
| Loan/Deposit | 99.2 | 99.3 | 99.4 | -1.0% | -0.8% | -1.2% | -1.6% |
| Dwellings Started | 100.8 | 100.6 | 100.3 | 2.7% | 2.4% | 2.1% | 0.2% |
| OT-MFG | 100.8 | 100.9 | 101.0 | -0.6% | 0.2% | 2.4% | 1.2% |
| Stocks/Deliv (M&M) | 98.9 | 98.9 | 98.9 | 0.5% | 0.5% | -1.8% | -2.6% |
| Exp>Imp | 100.4 | 100.2 | 100.0 | 2.1% | 2.3% | 0.1% | -0.8% |
| Grey shaded rows are one month behind current | |||||||
Robert Brusca
AuthorMore in Author Profile »Robert A. Brusca is Chief Economist of Fact and Opinion Economics, a consulting firm he founded in Manhattan. He has been an economist on Wall Street for over 25 years. He has visited central banking and large institutional clients in over 30 countries in his career as an economist. Mr. Brusca was a Divisional Research Chief at the Federal Reserve Bank of NY (Chief of the International Financial markets Division), a Fed Watcher at Irving Trust and Chief Economist at Nikko Securities International. He is widely quoted and appears in various media. Mr. Brusca holds an MA and Ph.D. in economics from Michigan State University and a BA in Economics from the University of Michigan. His research pursues his strong interests in non aligned policy economics as well as international economics. FAO Economics’ research targets investors to assist them in making better investment decisions in stocks, bonds and in a variety of international assets. The company does not manage money and has no conflicts in giving economic advice.
More Economy in Brief
 Global| Feb 05 2026
Charts of the Week: Balanced Policy, Resilient Data and AI Narratives
by:Andrew Cates


