 Global| Mar 03 2006
ISM Nonmanufacturing Index Recovered
by:Tom Moeller
|in:Economy in Brief
Summary
The Institute for Supply Management (ISM) reported that the February Business Activity Index for the non-manufacturing sector recovered most of the prior month's loss with a 3.3 point advance to 60.1. A reading above 50 indicates [...]
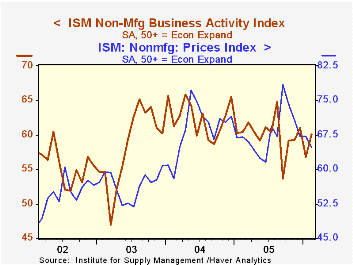
The Institute for Supply Management (ISM) reported that the February Business Activity Index for the non-manufacturing sector recovered most of the prior month's loss with a 3.3 point advance to 60.1. A reading above 50 indicates expansion. The gain outpaced Consensus expectations for a rise to 58.0.
Since the series' inception in 1997 there has been a 53% correlation between the level of the Business Activity Index and the q/q change in real GDP for services plus construction.
The employment index seemed to lead the m/m improvement and rose sharply to 58.2, the highest level since August. Since the series' inception in 1997 there has been a 60% correlation between the level of the ISM non-manufacturing employment index and the m/m change in payroll employment in the service producing plus the construction industries. The new orders index was roughly stable after a sharp decline during January.
Pricing power deteriorated to the weakest level since June. Since inception eight years ago, there has been a 70% correlation between the price index and the y/y change in the GDP Services chain price index.
ISM surveys more than 370 purchasing managers in more than 62 industries including construction, law firms, hospitals, government and retailers. The non-manufacturing survey dates only to July 1997, therefore its seasonal adjustment should be viewed tentatively.Business Activity Index for the non-manufacturing sector reflects a question separate from the subgroups mentioned above. In contrast, the NAPM manufacturing sector composite index is a weighted average five components.
"Measured Pace" in the Conduct of Monetary Policy from the Federal Reserve Bank of St. Louis can be found here.
| ISM Nonmanufacturing Survey | Feb | Jan | Feb '05 | 2005 | 2004 | 2003 |
|---|---|---|---|---|---|---|
| Business Activity Index | 60.1 | 56.8 | 60.4 | 60.1 | 62.5 | 58.3 |
| Prices Index | 64.8 | 67.2 | 67.0 | 67.9 | 68.8 | 56.6 |

Tom Moeller
AuthorMore in Author Profile »Prior to joining Haver Analytics in 2000, Mr. Moeller worked as the Economist at Chancellor Capital Management from 1985 to 1999. There, he developed comprehensive economic forecasts and interpreted economic data for equity and fixed income portfolio managers. Also at Chancellor, Mr. Moeller worked as an equity analyst and was responsible for researching and rating companies in the economically sensitive automobile and housing industries for investment in Chancellor’s equity portfolio. Prior to joining Chancellor, Mr. Moeller was an Economist at Citibank from 1979 to 1984. He also analyzed pricing behavior in the metals industry for the Council on Wage and Price Stability in Washington, D.C. In 1999, Mr. Moeller received the award for most accurate forecast from the Forecasters' Club of New York. From 1990 to 1992 he was President of the New York Association for Business Economists. Mr. Moeller earned an M.B.A. in Finance from Fordham University, where he graduated in 1987. He holds a Bachelor of Arts in Economics from George Washington University.
More Economy in Brief


