 Global| Mar 01 2010
ISM Manufacturing Index Fell From January High
by:Tom Moeller
|in:Economy in Brief
Summary
The rate of factory sector improvement eased slightly last month, according to the Institute for Supply Management. Perhaps due to cold weather, the February composite index slipped to 56.5 from January's 58.4. The latest remained the [...]
 The rate of
factory sector improvement eased slightly last month, according to the
Institute for Supply Management. Perhaps due to cold weather, the
February composite index slipped to 56.5 from January's 58.4. The
latest remained the second highest reading of the economic recovery. It
was up from the low of 32.9 reached in December '08. The latest figure
fell short of Consensus expectations for a reading of 57.8. (Any figure
above the break-even point of 50 suggests rising activity.) The ISM
data is available in Haver's USECON database.
The rate of
factory sector improvement eased slightly last month, according to the
Institute for Supply Management. Perhaps due to cold weather, the
February composite index slipped to 56.5 from January's 58.4. The
latest remained the second highest reading of the economic recovery. It
was up from the low of 32.9 reached in December '08. The latest figure
fell short of Consensus expectations for a reading of 57.8. (Any figure
above the break-even point of 50 suggests rising activity.) The ISM
data is available in Haver's USECON database.
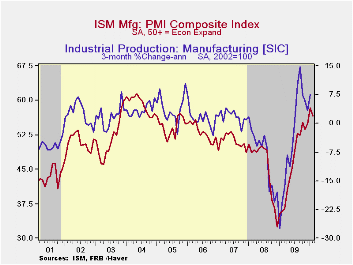
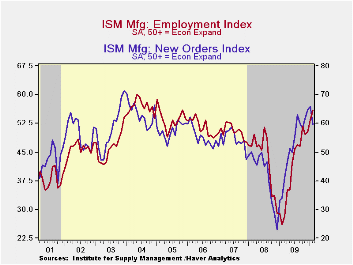
Declines in the production and new orders components accounted for the decline in the composite index. During the last ten years there has been an 84% correlation between the level of the production component of the composite index and the three-month growth in factory sector industrial production. It is appropriate to correlate the ISM index level with factory sector output growth because the ISM index is a diffusion index. It measures growth by using all of the positive changes in activity added to one half of the zero change in activity measures. Finally, the export order index fell to 56.5 and reversed half of its January increase. It still was up, however, from the low of 35.5 in December '08. During the last ten years there has been a 53% correlation between the index and the q/q change in real exports of goods in the GDP accounts.
To the upside was the employment index with a gain to 56.1, the highest level since 2005. It's up from a low reading of 25.9 last February. Twenty-two percent of firms indicated a higher level of payrolls versus 6% last February. Ten percent showed a lower level versus 54% last February. During the last ten years there has been a 90% correlation between the index level and the three-month change in manufacturing payrolls.
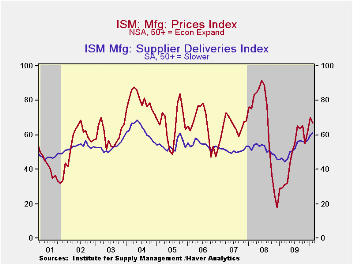
The rise in the inventory component to 47.3 brought it back to the October high. Nineteen percent of respondents reported lower inventories versus 43 percent last February. Seventeen percent (NSA) of respondents indicated that they were raising inventory levels versus 19% last February. During the strong 2005 inventory accumulation 26% of firms indicated that they were raising inventories. The vendor performance indicator, which measures the speed of deliveries, rose and indicated the slowest speed since 2005.
The separate index of prices paid fell from its cycle-high to 67.0. That still was up from the December '08 low of 18.0. During the last twenty years there has been a 79% correlation between the price index and the three-month change in the PPI for intermediate goods. Thirty-nine percent of respondents reported higher prices while only 5 percent indicated lower prices.
The ISM data are available in Haver's USECON database.
| ISM Mfg | February | January | December | Feb. '09 | 2009 | 2008 | 2007 |
|---|---|---|---|---|---|---|---|
| Composite Index | 56.5 | 58.4 | 54.9 | 35.7 | 46.2 | 45.5 | 51.1 |
| New Orders | 59.5 | 65.9 | 64.8 | 33.9 | 51.6 | 42.1 | 54.3 |
| Employment | 56.1 | 53.3 | 50.2 | 25.9 | 40.5 | 43.3 | 50.5 |
| Production | 58.4 | 66.2 | 59.7 | 35.6 | 50.4 | 45.2 | 54.1 |
| Supplier Deliveries | 61.1 | 60.1 | 56.8 | 46.6 | 51.4 | 51.6 | 51.2 |
| Inventories | 47.3 | 46.5 | 43.0 | 36.7 | 37.1 | 45.5 | 45.4 |
| Prices Paid Index (NSA) | 67.0 | 70.0 | 61.5 | 29.0 | 48.3 | 66.5 | 64.6 |

Tom Moeller
AuthorMore in Author Profile »Prior to joining Haver Analytics in 2000, Mr. Moeller worked as the Economist at Chancellor Capital Management from 1985 to 1999. There, he developed comprehensive economic forecasts and interpreted economic data for equity and fixed income portfolio managers. Also at Chancellor, Mr. Moeller worked as an equity analyst and was responsible for researching and rating companies in the economically sensitive automobile and housing industries for investment in Chancellor’s equity portfolio. Prior to joining Chancellor, Mr. Moeller was an Economist at Citibank from 1979 to 1984. He also analyzed pricing behavior in the metals industry for the Council on Wage and Price Stability in Washington, D.C. In 1999, Mr. Moeller received the award for most accurate forecast from the Forecasters' Club of New York. From 1990 to 1992 he was President of the New York Association for Business Economists. Mr. Moeller earned an M.B.A. in Finance from Fordham University, where he graduated in 1987. He holds a Bachelor of Arts in Economics from George Washington University.
More Economy in Brief


