 Global| Mar 01 2005
ISM Factory Index Slipped Again
by:Tom Moeller
|in:Economy in Brief
Summary
The Composite Index of activity in the manufacturing sector reported by the Institute of Supply Management slipped again in February to 55.3. The index has fallen during six of the last seven months. Consensus expectation had been for [...]
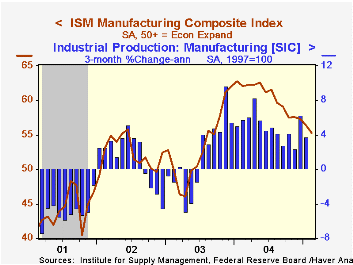
The Composite Index of activity in the manufacturing sector reported by the Institute of Supply Management slipped again in February to 55.3. The index has fallen during six of the last seven months. Consensus expectation had been for an increase to 57.0.
During the last twenty years there has been a 69% correlation between the level of the Composite Index and the three month growth in factory sector industrial production.
The new orders component slipped modestly following the sharp January decline to 55.8. The separate index of export orders rose 0.5 points, but the prior month's gain was reversed. The production index reversed all of the prior month's 1.1 point gain and the inventories index cratered 4.2 points to 48.6, the lowest level since last May.
The employment index slipped 0.7 points to 57.4 after the 4.8 point rise in January. During the last twenty years there has been a 69% correlation between the level of the ISM Employment Index and the three month growth in factory sector employment.
The prices paid index fell for the fourth straight month, off 3.5 points to 65.6 and down twenty two points from the high last April.
Is there evidence of the new economy in the U.S. GDP data? from the Federal Reserve Bank of Chicago can be found here.
| ISM Manufacturing Survey | Feb | Jan | Feb '04 | 2004 | 2003 | 2002 |
|---|---|---|---|---|---|---|
| Composite Index | 55.3 | 56.4 | 62.8 | 60.5 | 53.3 | 52.4 |
| New Orders Index | 56.5 | 62.6 | 69.2 | 63.5 | 57.9 | 56.5 |
| Prices Paid Index (NSA) | 69.0 | 72.0 | 75.5 | 79.8 | 59.6 | 57.6 |
by Tom Moeller March 1, 2005
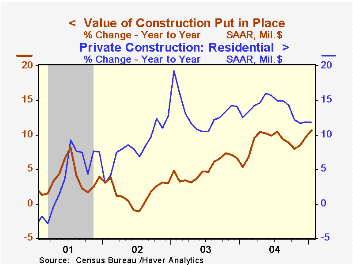
The total value of construction put in place rose another 0.7% in January. Revised figures indicate consistent gains throughout 2004. Consensus expectations had been for a 0.4% rise for January.
Private residential building activity rose 0.7% after an upwardly revised 1.2% rise in December. New single family building added 0.9% (11.8% y/y) to the 1.0% December gain.
Nonresidential building jumped 1.2% but the prior month's gain was lessened. The gain was led by large m/m increases in shopping centers (+40.5% y/y) and malls (+4.8% y/y).
Public construction rose 0.8%. Spending on residential projects rose 2.6% (17.3% y/y) and highways & streets, nearly one third of the value of public construction spending, rose 4.4% (15.7% y/y).
These more detailed categories represent the Census Bureau’s reclassification of construction activity into end-use groups. Finer detail is available for many of the categories; for instance, commercial construction is shown for Automotive sales and parking facilities, drugstores, building supply stores, and both commercial warehouses and mini-storage facilities. Note that start dates vary for some seasonally adjusted line items in 2000 and 2002 and that constant-dollar data are no longer computed.
| Construction Put-in-place | Jan | Dec | Y/Y | 2004 | 2003 | 2002 |
|---|---|---|---|---|---|---|
| Total | 0.7% | 1.2% | 10.6% | 8.9% | 5.1% | 1.5% |
| Private | 0.6% | 1.2% | 11.3% | 10.7% | 6.0% | -0.2% |
| Residential | 0.4% | 1.5% | 11.8% | 13.8% | 13.1% | 8.4% |
| Nonresidential | 1.2% | 0.3% | 10.1% | 3.7% | -7.1% | -12.8% |
| Public | 0.8% | 1.5% | 8.5% | 3.4% | 2.6% | 7.0% |
by Tom Moeller March 1, 2005
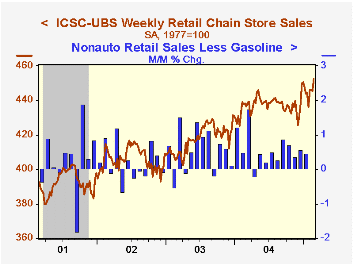
Chain store sales jumped 1.5% last week according to the International Council of Shopping Centers (ICSC)-UBS survey.
The strong end to February pulled the month's average 1.0% ahead of January and last week's sales were 3.8% above four weeks earlier.
During the last ten years there has been a 59% correlation between y/y change in chain store sales and the change in non-auto retail sales less gasoline, as published by the US Census Department.
The leading indicator of chain store sales from ICSC, down 0.6% (-0.2% y/y), fell for the second consecutive week. The indicator's February average nevertheless remained above January.
The ICSC-UBS retail chain-store sales index is constructed using the same-store sales (stores open for one year) reported by 78 stores of seven retailers: Dayton Hudson, Federated, Kmart, May, J.C. Penney, Sears and Wal-Mart.
| ICSC-UBS (SA, 1977=100) | 02/26/05 | 02/19/05 | Y/Y | 2004 | 2003 | 2002 |
|---|---|---|---|---|---|---|
| Total Weekly Chain Store Sales | 452.5 | 445.6 | 3.3% | 4.6% | 2.9% | 3.6% |

Tom Moeller
AuthorMore in Author Profile »Prior to joining Haver Analytics in 2000, Mr. Moeller worked as the Economist at Chancellor Capital Management from 1985 to 1999. There, he developed comprehensive economic forecasts and interpreted economic data for equity and fixed income portfolio managers. Also at Chancellor, Mr. Moeller worked as an equity analyst and was responsible for researching and rating companies in the economically sensitive automobile and housing industries for investment in Chancellor’s equity portfolio. Prior to joining Chancellor, Mr. Moeller was an Economist at Citibank from 1979 to 1984. He also analyzed pricing behavior in the metals industry for the Council on Wage and Price Stability in Washington, D.C. In 1999, Mr. Moeller received the award for most accurate forecast from the Forecasters' Club of New York. From 1990 to 1992 he was President of the New York Association for Business Economists. Mr. Moeller earned an M.B.A. in Finance from Fordham University, where he graduated in 1987. He holds a Bachelor of Arts in Economics from George Washington University.
More Economy in Brief


