 Global| Jul 01 2005
ISM Factory Index Recovered Some
by:Tom Moeller
|in:Economy in Brief
Summary
In June, the Composite Index of activity in the manufacturing sector compiled by the Institute of Supply Management rose 2.4 points to 53.8 and recovered all of the prior month's decline. Consensus expectations had been for stability [...]
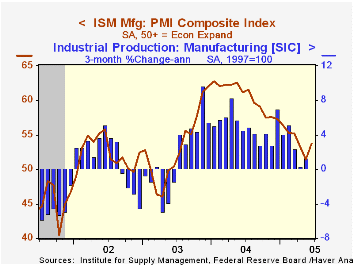
In June, the Composite Index of activity in the manufacturing sector compiled by the Institute of Supply Management rose 2.4 points to 53.8 and recovered all of the prior month's decline. Consensus expectations had been for stability at 51.5.
During the last twenty years there has been a 64% correlation between the level of the Composite Index and the three month growth in factory sector industrial production.
New orders recovered all of the decline during the prior two months with a 5.5 point rise to 57.2. The index of export orders, however, fell to the lowest since December 2001.
The employment index improved modestly to 49.9 but remained below the break even level of 50 for a second month. During the last twenty years there has been a 67% correlation between the level of the ISM Employment Index and the three month growth in factory sector employment.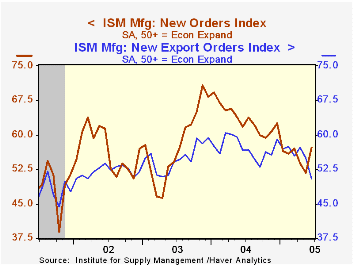
The production index (55.6) rose moderately while the inventories index was unchanged and below 50 for the third consecutive month.
The prices paid index again fell sharply to the lowest since early 2002. During the last twenty years there has been an 81% correlation between vendor delivery speed and prices.
| ISM Manufacturing Survey | June | May | June '04 | 2004 | 2003 | 2002 |
|---|---|---|---|---|---|---|
| Composite Index | 53.8 | 51.4 | 61.2 | 60.5 | 53.3 | 52.4 |
| New Orders Index | 57.2 | 51.7 | 61.8 | 63.5 | 57.9 | 56.5 |
| Prices Paid Index (NSA) | 50.5 | 58.0 | 81.0 | 79.8 | 59.6 | 57.6 |
by Tom Moeller July 1, 2005
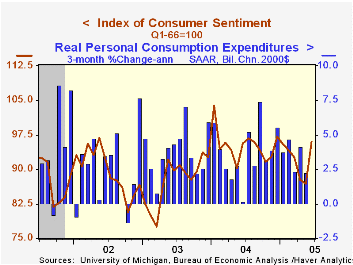
The University of Michigan's final reading of consumer sentiment in June extended the early-month improvement and rose 10.5% versus May to 96.0, the highest level this year. Consensus expectations had been for a lesser increase to 94.6.
During the last ten years there has been a 74% correlation between the level of consumer sentiment and the y/y change in real PCE, although the correlation has fallen in recent years.
The reading of current economic conditions improved sharply late in the month and for June overall rose 7.9% to the highest level since late 2000.
Consumer expectations added slightly to the gain earlier in the month and surged 12.9% following five months of decline.
The University of Michigan survey is not seasonally adjusted.The mid-month survey is based on telephone interviews with 250 households nationwide on personal finances and business and buying conditions. The survey is expanded to a total of 500 interviews at month end.
Consumption Taxes: Macroeconomic Effects and Policy Issues from the Federal Reserve Bank of Kansas City can be found here.
| University of Michigan | June | May | Y/Y | 2004 | 2003 | 2002 |
|---|---|---|---|---|---|---|
| Consumer Sentiment | 96.0 | 86.9 | 0.4% | 95.2 | 87.6 | 89.6 |
| Current Conditions | 113.2 | 104.9 | 6.1% | 105.6 | 97.2 | 97.5 |
| Consumer Expectations | 85.0 | 75.3 | -4.0% | 88.5 | 81.4 | 84.6 |
by Tom Moeller July 1, 2005
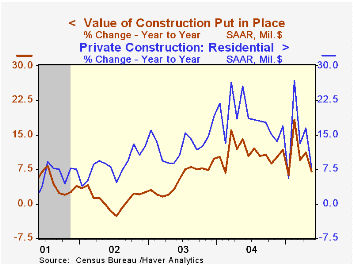
The total value of construction put in place fell in May for the fourth month this year. The 0.9% decline followed a revised 1.1% drop in April. Consensus expectations had been for a 0.5% increase.
The 2004 increase in total construction spending was revised up to 11.1% from 8.9% as a result of a strengthened gain in residential building to 18.5% from 13.9%.
Since then private residential building activity has fallen sharply, down 4.9% during the last three months. The value of new single family building, however, has continued to rise by 0.5% (7.6% y/y) in May. Building on new multi-family units fell 0.9% (15.0% y/y).
Nonresidential building slipped 1.6% (+5.0% y/y) due to a 1.2% (+2.4% y/y) decline in office building.
Public construction spending rose 1.7% but the steam came out of spending on highways & streets, nearly one third of the value of public construction spending, as y/y growth slowed to 5.4% from the high of 19.7% in February.
These more detailed categories represent the Census Bureau’s reclassification of construction activity into end-use groups. Finer detail is available for many of the categories; for instance, commercial construction is shown for Automotive sales and parking facilities, drugstores, building supply stores, and both commercial warehouses and mini-storage facilities. Note that start dates vary for some seasonally adjusted line items in 2000 and 2002 and that constant-dollar data are no longer computed.
| Construction Put-in-place | May | April | Y/Y | 2004 | 2003 | 2002 |
|---|---|---|---|---|---|---|
| Total | -0.9% | -1.1% | 8.2% | 11.1% | 5.4% | 1.0% |
| Private | -1.6% | -1.5% | 7.0% | 13.8% | 6.3% | -0.4% |
| Residential | -1.7% | -2.2% | 7.8% | 18.5% | 12.9% | 8.5% |
| Nonresidential | -1.6% | 0.6% | 5.0% | 3.9% | -5.4% | -13.0% |
| Public | 1.7% | 0.2% | 7.1% | 2.5% | 2.7% | 5.7% |

Tom Moeller
AuthorMore in Author Profile »Prior to joining Haver Analytics in 2000, Mr. Moeller worked as the Economist at Chancellor Capital Management from 1985 to 1999. There, he developed comprehensive economic forecasts and interpreted economic data for equity and fixed income portfolio managers. Also at Chancellor, Mr. Moeller worked as an equity analyst and was responsible for researching and rating companies in the economically sensitive automobile and housing industries for investment in Chancellor’s equity portfolio. Prior to joining Chancellor, Mr. Moeller was an Economist at Citibank from 1979 to 1984. He also analyzed pricing behavior in the metals industry for the Council on Wage and Price Stability in Washington, D.C. In 1999, Mr. Moeller received the award for most accurate forecast from the Forecasters' Club of New York. From 1990 to 1992 he was President of the New York Association for Business Economists. Mr. Moeller earned an M.B.A. in Finance from Fordham University, where he graduated in 1987. He holds a Bachelor of Arts in Economics from George Washington University.
More Economy in Brief


