 Global| Dec 01 2006
ISM Composite Index Lowest Since 2003
by:Tom Moeller
|in:Economy in Brief
Summary
The November composite index of manufacturing activity from the Institute for Supply Management fell to 49.5 from 51.2 the prior month. The decline plopped the index below the break even level of 50 for the first month since April [...]
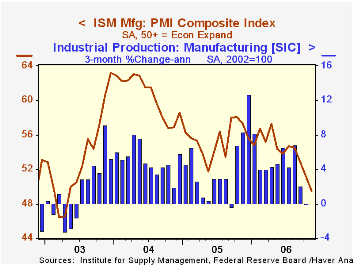
The November composite index of manufacturing activity from the Institute for Supply Management fell to 49.5 from 51.2 the prior month. The decline plopped the index below the break even level of 50 for the first month since April 2003. Consensus expectations had been for stability at 52.0 but the market's expectation was altered by yesterday's weak Chicago PMI report.
During the last ten years there has been a 67% correlation between the level of the ISM index and three month growth in factory sector industrial production.
The new orders component at 48.7 and production at 48.5 led the m/m declines. The new export orders index also fell moderately to 56.9. The series peak was in early 2004 near 60. During the last ten years there has been a 69% correlation between the level of the export order index and the q/q growth in goods exports from the GDP accounts. The imports index also fell slightly.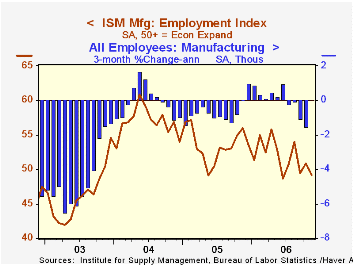
Employment also dropped below the break-even level to 49.2. During the last ten years there has been a 77% correlation between the level of the ISM employment Index and the three month growth in factory sector employment.
A higher vendor deliveries index (52.8) and a higher inventories series (49.7) dampened the decline in the Composite index.
The price index, which is not included in the composite, rose for the first month in the last four.
During the last ten years there has been an 89% correlation between the level of the price index and the three month change in the PPI for intermediate goods less food & energy.
The Long-Run Effects of the Bankruptcy Reform Bill from the Federal Reserve Bank of Philadelphia is available here
| ISM Manufacturing Survey | November | October | Nov. '05 | 2005 | 2004 | 2003 |
|---|---|---|---|---|---|---|
| Composite Index | 49.5 | 51.2 | 57.3 | 55.5 | 60.5 | 53.3 |
| Prices Index (NSA) | 53.5 | 47.0 | 74.0 | 66.4 | 79.8 | 59.6 |

Tom Moeller
AuthorMore in Author Profile »Prior to joining Haver Analytics in 2000, Mr. Moeller worked as the Economist at Chancellor Capital Management from 1985 to 1999. There, he developed comprehensive economic forecasts and interpreted economic data for equity and fixed income portfolio managers. Also at Chancellor, Mr. Moeller worked as an equity analyst and was responsible for researching and rating companies in the economically sensitive automobile and housing industries for investment in Chancellor’s equity portfolio. Prior to joining Chancellor, Mr. Moeller was an Economist at Citibank from 1979 to 1984. He also analyzed pricing behavior in the metals industry for the Council on Wage and Price Stability in Washington, D.C. In 1999, Mr. Moeller received the award for most accurate forecast from the Forecasters' Club of New York. From 1990 to 1992 he was President of the New York Association for Business Economists. Mr. Moeller earned an M.B.A. in Finance from Fordham University, where he graduated in 1987. He holds a Bachelor of Arts in Economics from George Washington University.
More Economy in Brief


