 Global| Nov 01 2006
ISM Composite Index Fell, Price Index Below 50
by:Tom Moeller
|in:Economy in Brief
Summary
The Institute for Supply Management reported that last month's composite index of manufacturing sector activity fell to 51.2 from 52.9 during September. The decline was the fifth in the last six months and was to the lowest level [...]
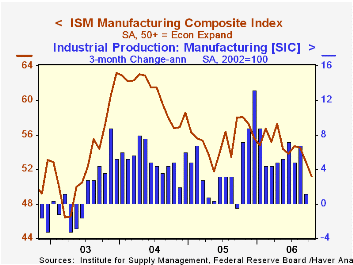
The Institute for Supply Management reported that last month's composite index of manufacturing sector activity fell to 51.2 from 52.9 during September. The decline was the fifth in the last six months and was to the lowest level since July 2003. Consensus expectations had been for stability at 53.0.
During the last ten years there has been a 67% correlation between the level of the ISM index and three month growth in factory sector industrial production.
The price index, which is not included in the composite, collapsed to 47.0. The reading was the first below 50 in over one year and reflected just 18% of respondents reporting higher prices, 58% with prices unchanged and 24% indicating lower prices.
During the last ten years there has been an 89% correlation between the level of the price index and the three month change in the PPI for intermediate goods less food & energy.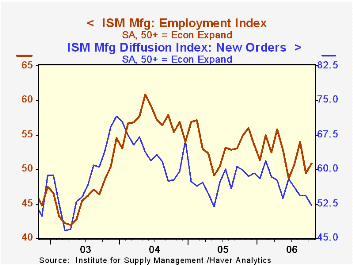
A lower new orders (52.1) and a lower production (51.9) component led the composite index down. In addition, the vendor performance measure fell to 50.2, indicating the quickest delivery speeds since July 2003. The inventories index rose to a low 49.2.
The new export orders index at 57.8 improved to its highest level January. The series peak was in early 2004 near 60. During the last ten years there has been a 69% correlation between the level of the export order index and the q/q growth in goods exports from the GDP accounts. The imports index rose slightly.
Employment also improved, marginally, to a barely break-even 50.8. During the last ten years there has been a 77% correlation between the level of the ISM employment Index and the three month growth in factory sector employment.
U.S. Maneuvers Through Choppy Waters from the Federal Reserve Bank of St. Louis is available here.
The Yield Curve as a Leading Indicator: Some Practical Issues from the Federal Reserve Bank of New York can be found here.
| ISM Manufacturing Survey | October | September | Oct. '05 | 2005 | 2004 | 2003 |
|---|---|---|---|---|---|---|
| Composite Index | 51.2 | 52.9 | 58.1 | 55.5 | 60.5 | 53.3 |
| Prices Index (NSA) | 47.0 | 61.0 | 84.0 | 66.4 | 79.8 | 59.6 |

Tom Moeller
AuthorMore in Author Profile »Prior to joining Haver Analytics in 2000, Mr. Moeller worked as the Economist at Chancellor Capital Management from 1985 to 1999. There, he developed comprehensive economic forecasts and interpreted economic data for equity and fixed income portfolio managers. Also at Chancellor, Mr. Moeller worked as an equity analyst and was responsible for researching and rating companies in the economically sensitive automobile and housing industries for investment in Chancellor’s equity portfolio. Prior to joining Chancellor, Mr. Moeller was an Economist at Citibank from 1979 to 1984. He also analyzed pricing behavior in the metals industry for the Council on Wage and Price Stability in Washington, D.C. In 1999, Mr. Moeller received the award for most accurate forecast from the Forecasters' Club of New York. From 1990 to 1992 he was President of the New York Association for Business Economists. Mr. Moeller earned an M.B.A. in Finance from Fordham University, where he graduated in 1987. He holds a Bachelor of Arts in Economics from George Washington University.
More Economy in Brief


