 Global| Jun 16 2005
Initial Unemployment Insurance Claims Flat
by:Tom Moeller
|in:Economy in Brief
Summary
Initial claims for unemployment insurance remained about flat last week, rising 1,000 to 333,000 from an upwardly revised level the week prior. Consensus expectations had been for 328,000 claims. During the last ten years there has [...]
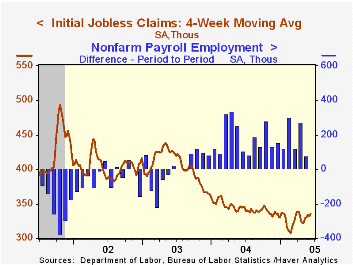
Initial claims for unemployment insurance remained about flat last week, rising 1,000 to 333,000 from an upwardly revised level the week prior. Consensus expectations had been for 328,000 claims.
During the last ten years there has been a (negative) 75% correlation between the level of initial claims for unemployment insurance and the monthly change in payroll employment. There has been a (negative) 65% correlation with the level of continuing claims.
The four week moving average of initial claims increased modestly to 335,000 (-2.7% y/y).
Continuing claims for unemployment insurance jumped 58,000 following a deepened 9,000 decline the prior week.
The insured unemployment rate increased slightly to 2.1% after seven weeks at 2.0%.
The latest Beige Book from the Federal Reserve Board covering regional economic conditions is available here.
| Unemployment Insurance (000s) | 06/11/05 | 06/04/05 | Y/Y | 2004 | 2003 | 2002 |
|---|---|---|---|---|---|---|
| Initial Claims | 333 | 332 | -2.3% | 343 | 402 | 404 |
| Continuing Claims | -- | 2,641 | -9.1% | 2,926 | 3,531 | 3,570 |
by Tom Moeller June 16, 2005
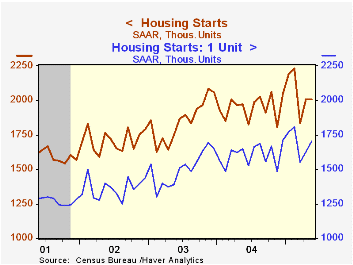
Housing starts edged 0.2% higher to 2.009M units in May following a downwardly revised 9.4% gain in April.Consensus expectations had been for 2.041M starts.
Single-family starts rose 4.7% m/m on top of the downwardly revised 5.0% increase during April. An 8.0% (3.8% y/y) increase single family starts in the Northeast recovered all of the prior month's decline but the level has been trending sideways-to-lower since late last year. Single family starts in the Midwest jumped 22.0% (4.1% y/y) and starts in the West surged 19.1 (-6.9% y/y). Weakness last month was in the South where a 7.8% (+10.0% y/y) decline reversed half of the prior month's surge.
Multi family starts reversed nearly all of the prior month's gain with a 19.3% decline.
Building permits fell 4.6% and have been slightly lower this year.
| Housing Starts (000s, AR) | May | April | Y/Y | 2004 | 2003 | 2002 |
|---|---|---|---|---|---|---|
| Total | 2,009 | 2,005 | 1.8% | 1,950 | 1,854 | 1,7 10 |
| Single-family | 1,704 | 1,627 | 3.3% | 1,604 | 1,505 | 1,363 |
| Multi-family | 305 | 378 | -6.2% | 345 | 349 | 347 |
| Building Permits | 2,050 | 2,148 | -3.7% | 2,058 | 1,8 88 | 1,749 |
by Tom Moeller June 16, 2005
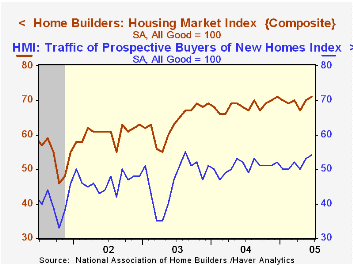
The National Association of Home Builders' (NAHB) Composite Housing Market Index rose to 71 in June, returning to the record high level reached last December.
During the last twenty years, annual changes in the composite index had an 83% correlation with the change in new home sales. There's been an 86% correlation with the change in single family housing starts.
For the second month, all of the June index components improved. The index for current sales of single family homes was up 4.1% y/y and the index gauging expected sales in six months increased 5.3% y/y.
Traffic of prospective home buyers rose nearly to the record high level.
The NAHB index is a diffusion index based on a survey of builders. Readings above 50 signal that more builders view conditions as good than poor.
Visit the National Association of Home Builders.
| Nat'l Association of Home Builders | June | May | June '04 | 2004 | 2003 | 2002 |
|---|---|---|---|---|---|---|
| Composite Housing Market Index | 71 | 70 | 68 | 68 | 64 | 61 |
by Carol Stone June 16, 2005
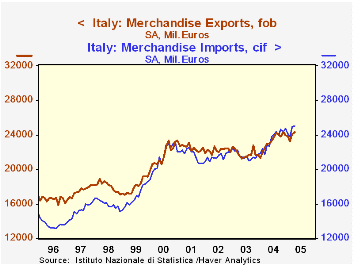
Foreign trade for Italy has swung from a comfortable surplus two years ago to a persistent and increasing deficit. The April figures, reported today, show a shortfall of €784 million following on March's €872 million. This deterioration came despite notable increases in exports, amounting to more than a million euros in the past year, including double-digit yearly percentage gains in several recent months. Imports have obviously gone up more than exports, growing €2.2 billion in the past year. More significantly, the accompanying graph shows that Italy was traditionally in an overall surplus trade position, which reached as high as €3.6 billion in mid-1996.
As seen in the table below, energy is a major ingredient in the move to a trade deficit. The balance there was -€3.3 billion in April, €1.0 billion bigger than the year-ago amount and the largest in the history of these particular data, which go back to 1991.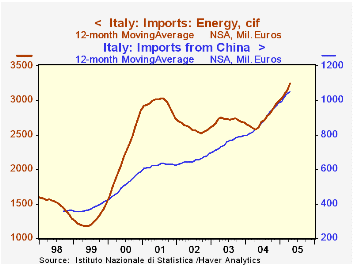
But energy is not the only factor. Similar shifts have occurred in intra-Euro-Zone trade, which illustrates the result of growth in imports that outstrips growth in exports. Also, in non-Euro countries, the trade position with China is moving gradually toward a larger deficit. This latter is a more modest phenomenon, but it contrasts distinctly with the experience elsewhere in Asia: trade with Japan is moving to smaller deficits as imports from there tend downward irregularly. Trade with Asian NICs remains generally in modest surplus, with the occasional monthly deficit. Trade with other regions, such as the United States, seems to be maintaining former patterns.
These changes toward a trade deficit for Italy are not of great magnitude. But the move to persisting deficit for a nation long in surplus is notable. It highlights some key sensitivities in today's global economy: energy imports and merchandise flows from China. At the same time, it also highlights the increasing volume of two-way trade with neighboring nations. These patterns are likely to be hallmarks of every nation's business in the days ahead.
| Italy ( SA, Millions of €) |
Apr 2005 | Mar 2005 | Apr 2004 | Monthly Averages|||
|---|---|---|---|---|---|---|
| 2004 | 2003 | 2002 | ||||
| Balance | -784 | -872 | +183 | -126 | +229 | +735 |
| Exports | 24,282 | 24,086 | 23,048 | 23,391 | 21,721 | 22,153 |
| Imports | 25,066 | 24,958 | 22,865 | 23,517 | 21,491 | 21,418 |
| Balance on Energy (NSA) | -3,258 | -2,976 | -2,221 | -2,438 | -2,209 | -2,203 |

Tom Moeller
AuthorMore in Author Profile »Prior to joining Haver Analytics in 2000, Mr. Moeller worked as the Economist at Chancellor Capital Management from 1985 to 1999. There, he developed comprehensive economic forecasts and interpreted economic data for equity and fixed income portfolio managers. Also at Chancellor, Mr. Moeller worked as an equity analyst and was responsible for researching and rating companies in the economically sensitive automobile and housing industries for investment in Chancellor’s equity portfolio. Prior to joining Chancellor, Mr. Moeller was an Economist at Citibank from 1979 to 1984. He also analyzed pricing behavior in the metals industry for the Council on Wage and Price Stability in Washington, D.C. In 1999, Mr. Moeller received the award for most accurate forecast from the Forecasters' Club of New York. From 1990 to 1992 he was President of the New York Association for Business Economists. Mr. Moeller earned an M.B.A. in Finance from Fordham University, where he graduated in 1987. He holds a Bachelor of Arts in Economics from George Washington University.
More Economy in Brief


