 Global| Feb 08 2007
Initial Claims for Unemployment Insurance Inched Up
by:Tom Moeller
|in:Economy in Brief
Summary
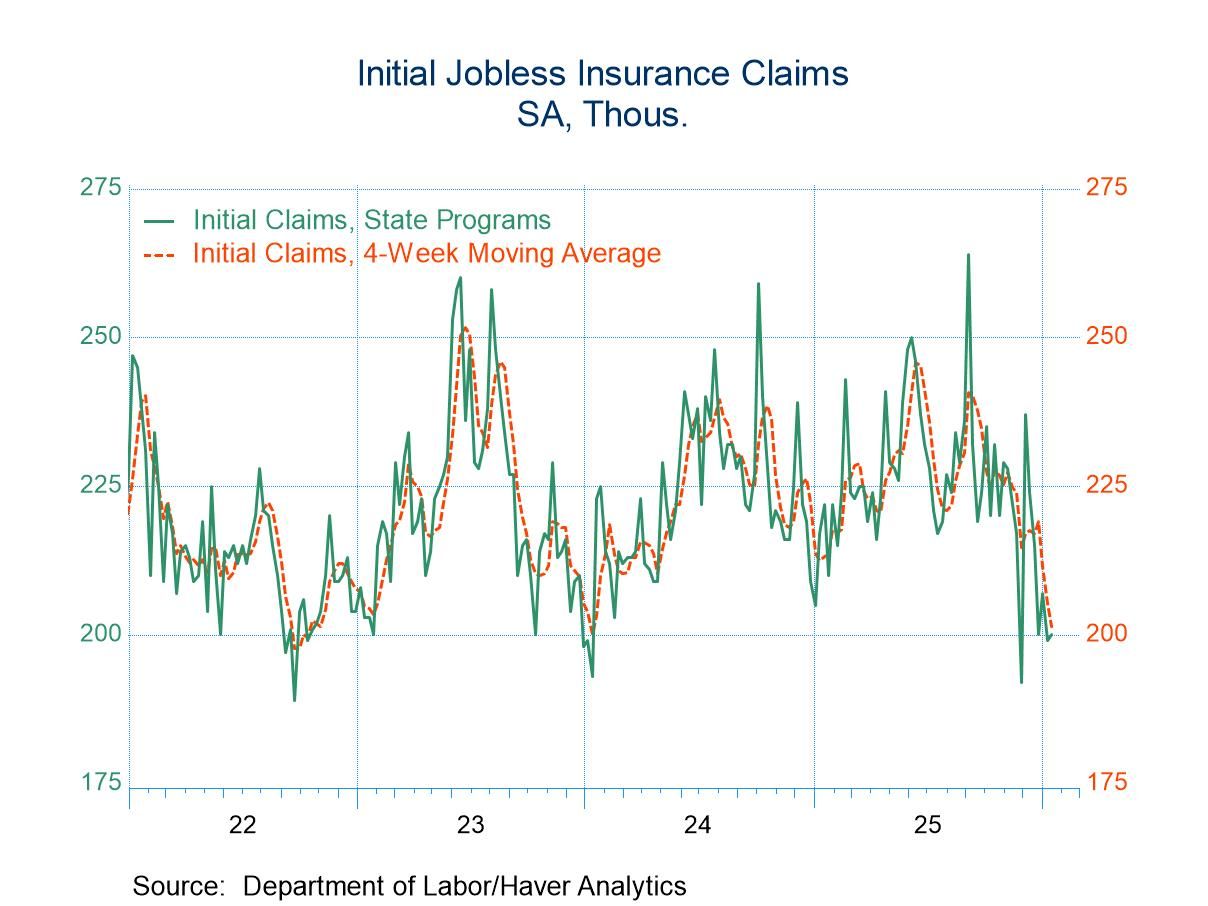
Initial unemployment insurance claims inched up 3,000 last week to 311,000 after a little revised 19,000 decline the week prior. The figure about matched Consensus expectations for 310,000 claims. During the last ten years there has [...]
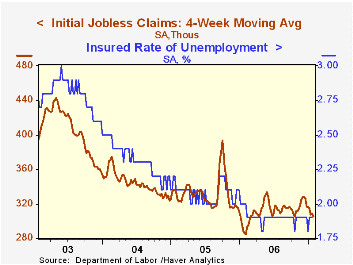
Initial unemployment insurance claims inched up 3,000 last week to 311,000 after a little revised 19,000 decline the week prior. The figure about matched Consensus expectations for 310,000 claims.
During the last ten years there has been a (negative) 77% correlation between the level of initial claims and the m/m change in nonfarm payroll employment.
The four-week moving average of initial claims rose slightly to 308,250 (8.3% y/y).
A 54,000 (-2.3% y/y) drop in continuing claims for unemployment insurance reversed most of a downwardly revised 62,000 jump the week prior.
The insured rate of unemployment remained at 1.9%, about where it's been since February.
In the latest week, initial claims rose sharply in California (16.5% y/y) but fell in most other states. In New York claims fell (2.7%) y/y but in Illinois claims rose 13.7% y/y, in Michigan they fell 10.8% y/y and in Massachusetts claims rose 4.2% y/y. These weekly figures are available in Haver's REGIONW database.
The Role of Labor Market Intermittency in Explaining Gender Wage Differentials from the Federal Reserve Bank of Atlanta is available here.
The Economics of Immigration from the Federal Reserve Bank of Minneapolis can be found here.
| Unemployment Insurance (000s) | 02/03/07 | 01/27/07 | Y/Y | 2006 | 2005 | 2004 |
|---|---|---|---|---|---|---|
| Initial Claims | 311 | 308 | 6.5% | 313 | 332 | 343 |
| Continuing Claims | -- | 2,490 | -2.3% | 2,459 | 2,662 | 2,924 |
by Carol Stone February 8, 2007
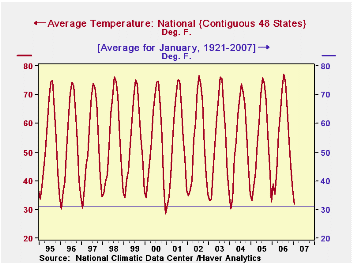
With increasing attention to "climate change", some very simple data take on more prominence. The National Climatic Data Center, a division of the National Oceanic and Atmospheric Administration of the Commerce Department, maintains temperature and precipitation records for the nation, regions and states. We wrote about these data last June, which was a particularly hot, dry month. Yesterday, the averages were published for January. Haver has for some time had these in both USECON for the national average and in REGIONAL for 9 regions and 48 states.
January's average temperature was 31.8°F, compared with an average since 1921 of 31.1°F. A year ago, which we recall as a mild winter, the January average temperature was 39.0°F. While this current period seems close to "normal", the regional breakdown shows considerable variation: of 9 regions, only one, the Northwest, was within a degree of its long-term January average, while three regions were chillier and five were warmer.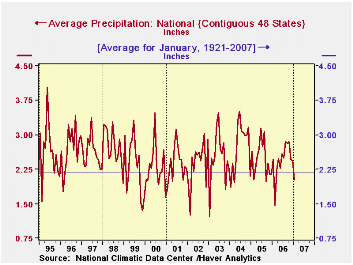
The amount of precipitation in January was 2.02", slightly less than the average of 2.18" since 1921. Last year and the year before were both somewhat wetter, at 2.46" and 2.65", respectively. Among the regions, there's a tendency toward dryness, as five regions had at least a quarter inch less precipitation than average, with two regions within 0.1" of average and two wetter than average.
When we examined these data in early July for June, we did so using Haver's DLX Excel add-in to make a spreadsheet full of June figures. The add-in entered the series codes we highlighted in DLXVG3 and traced out the range in which DLX would place the figures in the spreadsheet. So today, we simply revised that spreadsheet using a simple "replace" procedure to change the dates from yyyy06 to yyyy01 and adding a row to the bottom for 2007's entry. These two changes got us 87 years of January data for the 48-state total and 9 climate regions, along with means, medians and other statistics, within just a couple of minutes.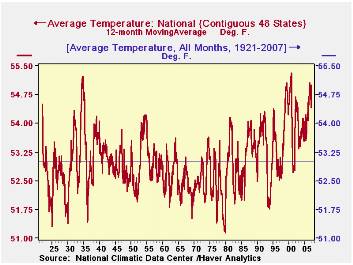
This array can help us tell quickly, for instance, that January 2006 was the warmest on record and was also the warmest for three regions, Central states, East North Central and West North Central. However, the warmest January in the South was way back in 1923 and in the Northeast, it was in 1932. What about so-called "global warming"? In the overall scheme of these things, 87 years isn't long. But in the third graph here, we show a 12-month moving average of the national temperature since 1921. This yearly average has clearly been rising since 1980, albeit from a low level then, and has been almost continuously above the long-term average since 1998.
| U.S. Weather | January 2007 | January 2006 | January 2005 | Averages of Januaries||||
|---|---|---|---|---|---|---|---|
| 2001-2007 | 1976-2000 | 1951-1975 | 1921-2007 | ||||
| Temperature (degrees F) | 31.8 | 39.0 | 33.2 | 33.39 | 30.93 | 30.73 | 31.08 |
| Precipitation (inches) | 2.02 | 2.46 | 2.65 | 1.99 | 2.25 | 2.14 | 2.18 |
Tom Moeller
AuthorMore in Author Profile »Prior to joining Haver Analytics in 2000, Mr. Moeller worked as the Economist at Chancellor Capital Management from 1985 to 1999. There, he developed comprehensive economic forecasts and interpreted economic data for equity and fixed income portfolio managers. Also at Chancellor, Mr. Moeller worked as an equity analyst and was responsible for researching and rating companies in the economically sensitive automobile and housing industries for investment in Chancellor’s equity portfolio. Prior to joining Chancellor, Mr. Moeller was an Economist at Citibank from 1979 to 1984. He also analyzed pricing behavior in the metals industry for the Council on Wage and Price Stability in Washington, D.C. In 1999, Mr. Moeller received the award for most accurate forecast from the Forecasters' Club of New York. From 1990 to 1992 he was President of the New York Association for Business Economists. Mr. Moeller earned an M.B.A. in Finance from Fordham University, where he graduated in 1987. He holds a Bachelor of Arts in Economics from George Washington University.


