 Global| Oct 05 2006
Initial Claims for Jobless Insurance At Ten Week Low
by:Tom Moeller
|in:Economy in Brief
Summary
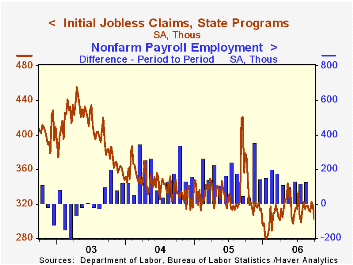
Initial claims for jobless insurance dropped 17,000 to 302,000, following the 3,000 decline the prior week which was slightly shallower than initially reported. Consensus expectations had been for 315,000 claims. During the last ten [...]

Initial claims for jobless insurance dropped 17,000 to 302,000, following the 3,000 decline the prior week which was slightly shallower than initially reported. Consensus expectations had been for 315,000 claims.
During the last ten years there has been a (negative) 78% correlation between the level of initial claims and the m/m change in nonfarm payroll employment.
The four-week moving average of initial claims fell slightly to 313,500 (-20.4% y/y). 
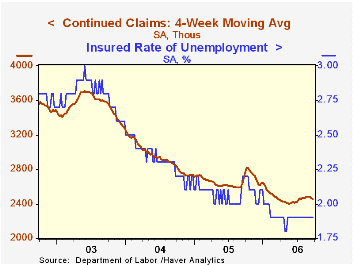
Continuing claims for unemployment insurance fell 8,000 after a 38,000 drop the prior week that was deeper than initially reported.
The insured rate of unemployment was steady at 1.9% where it has been since February.
Economic Outlook, last night's remarks by Fed Vice Chairman Donald L. Kohn, can be found here. Chairman Bernanke's comments on The Coming Demographic Transition can be found with yesterday's ADP write-up.
| Unemployment Insurance (000s) | 9/30/06 | 9/23/06 | Y/Y | 2005 | 2004 | 2003 |
|---|---|---|---|---|---|---|
| Initial Claims | 302 | 319 | -20.3% | 332 | 343 | 403 |
| Continuing Claims | -- | 2,448 | -13.9% | 2,662 | 2,924 | 3,532 |
by Carol Stone October 5, 2006

Industrial production in Brazil rose 0.7% in August, according to the official Institute for Brazilian Geography and Statistics (IBGE), in a report out this morning. This followed a similar 0.7% gain in July, more than offsetting a 1.1% decline in June.
In the August result, capital goods and consumer durables were the sources of strength, the former up 2.8% and the latter, 1.6%. Intermediate goods output increased 0.6% as did the combined semi-durable and nondurable consumer goods.
Press coverage of these data was contradictory, giving an almost comedic vision of the "two-handed economist". One news service, which conducts a forecast survey, said the 0.7% total increase was "stronger than expected" by its survey, which looked to a 0.5% rise. This service highlighted the favorable impact on the real economy of much lower interest rates. Indeed, the overnight "Selic" interest rate averaged 14.66% in August, down from 19.75% a year ago and the lowest in the 20-year history of this money-market rate.
"On the other hand", another prominent wire-service bemoaned "slowing growth", noting that the year-on-year gain in August IP was "just" 3.2%, less than July's 3.5%. Various other time span comparisons can also be construed as suggesting the onset of less vigorous growth. This news service "blamed" the strengthening of the currency which makes Brazil's products less competitive; indeed, the JP Morgan real effective exchange rate averaged 141.1 (2000=100) in September, among the highest single monthly values in the series, which extends back to 1970.
Differing interpretations can support either of these views. What does seem apparent to us is that Brazilian output swings widely: the recent pattern in industrial production can be seen as slow relative to double-digit gains in mid-2004 or stronger than the nearly stagnant performance in mid-2005. However, through this recent period, interest rates have been declining, the currency has been stronger (albeit with smaller gains than last year), and the stock market has corrected modestly after a steep run-up. This financial backdrop is yielding an inflow of capital funds for investment even as the current account remains in comfortable surplus. This sounds fairly attractive to us. The Brazilian people seem to agree: the National Confederation of Industry released its quarterly consumer confidence survey this morning as well. Its index of consumer expectations surged 5.8 points to a record in Q3 as respondents' assessments of nearly every macroeconomic measure were increasingly favorable.
| Aug 2006 | July 2006 | June 2006 | Year Ago | 2005 | 2004 | 2003 | |
|---|---|---|---|---|---|---|---|
| Total | 116.12 | 115.30 | 114.48 | 112.63 | 111.71 | 108.36 | 100.05 |
| % Change | 0.7 | 0.7 | -1.1 | 3.2 | 3.1 | 8.3 | 0.1 |
| Capital Goods | 2.8 | 1.2 | -0.5 | 7.4 | 3.6 | 19.7 | 2.2 |
| Intermediate Goods | 0.6 | 1.2 | -1.5 | 3.4 | 0.9 | 7.4 | 2.0 |
| Consumer Durable Goods | 1.6 | -0.2 | -0.9 | 5.4 | 11.4 | 21.8 | 3.0 |
| Consumer Semi- durable & Nondurable Goods | 0.6 | 3.0 | 1.7 | 1.2 | 4.6 | 4.0 | -3.9 |
Tom Moeller
AuthorMore in Author Profile »Prior to joining Haver Analytics in 2000, Mr. Moeller worked as the Economist at Chancellor Capital Management from 1985 to 1999. There, he developed comprehensive economic forecasts and interpreted economic data for equity and fixed income portfolio managers. Also at Chancellor, Mr. Moeller worked as an equity analyst and was responsible for researching and rating companies in the economically sensitive automobile and housing industries for investment in Chancellor’s equity portfolio. Prior to joining Chancellor, Mr. Moeller was an Economist at Citibank from 1979 to 1984. He also analyzed pricing behavior in the metals industry for the Council on Wage and Price Stability in Washington, D.C. In 1999, Mr. Moeller received the award for most accurate forecast from the Forecasters' Club of New York. From 1990 to 1992 he was President of the New York Association for Business Economists. Mr. Moeller earned an M.B.A. in Finance from Fordham University, where he graduated in 1987. He holds a Bachelor of Arts in Economics from George Washington University.
More Economy in Brief
 Global| Feb 05 2026
Charts of the Week: Balanced Policy, Resilient Data and AI Narratives
by:Andrew Cates


