 Global| May 22 2006
Inflation Pressure Up
by:Tom Moeller
|in:Economy in Brief
Summary
Gold prices near $700.00 per ounce of late point up the not-so-latent market concerns that inflationary pressure is rising. Since 1980 there has been a 56% correlation between the level of gold prices and the y/y change in consumer [...]
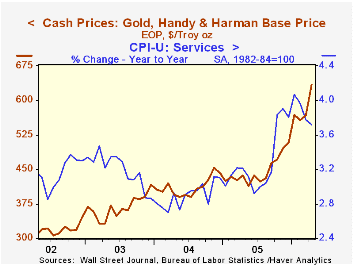
Gold prices near $700.00 per ounce of late point up the not-so-latent market concerns that inflationary pressure is rising. Since 1980 there has been a 56% correlation between the level of gold prices and the y/y change in consumer prices.
Concerns were further heightened by the report that "core" consumer price inflation in April was 2.3% (y/y). That was no higher than during early 2005 but it was an acceleration from 2.0% last summer. Faster growth in shelter prices is behind some of the acceleration though prices in many other categories of services, such as education & communication, recreation and public transportation have accelerated as well. Tempering the acceleration has been a sharp drop in in medical care services price inflation. 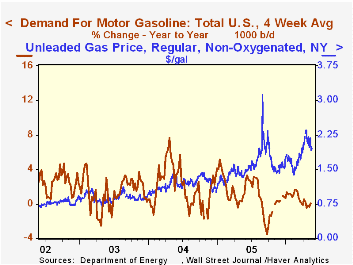
Despite slower growth in gasoline demand, retail gasoline prices have moved higher to $2.95 per gallon. Spot gasoline prices fell to under $2.00 per gallon in New York, down roughly 10% from the peak early this month, while crude oil prices similarly are off nearly ten percent from their highs.
Industrial metal prices also have been rising. The JoC-ECRI Industrial Metals Prices Index is up 24.5% this year as prices for aluminum (up 32.9%), copper scrap (up 49.7%) and zinc (up 88.0%) all have been strong. High grade copper prices are up 73.5% since year end '05. Growth in industrial production is behind the rise and during the last ten years there has been a 49% correlation between the level of industrial metals' prices and the y/y change in OECD Big Seven industrial production.
| Weekly Prices | 05/16/06 | 12/27/05 | Y/Y | 2005 | 2004 | 2003 |
|---|---|---|---|---|---|---|
| Light Sweet Crude Oil, WTI (per bbl.) | $69.54 | $58.16 | 42.0% | $58.16 | $41.78 | $32.78 |
| U.S. Retail Gasoline (per gallon) | $2.95 | $2.20 | 36.2% | $2.27 | $1.85 | $1.56 |
| Gold: Handy & Harmon (per Troy Oz., EOP) | $692.00 | $507.40 | 64.8% | $507.40 | $443.40 | $416.25 |
| High Grade Copper (Comex, /Lb., EOP) | $3.98 | $2.28 | 177.8% | $2.28 | $1.54 | $1.04 |
| Stainless Steel Scrap (/ton, EOP) | $1,574 | $1,268 | -4.1% | $1,268 | $1,558 | $1,265 |
by Louise Curley May 22 2006
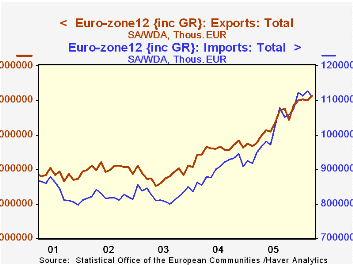
The Euro Zone as a whole has typically had a surplus on its trade in goods with non Euro Zone countries. However, in August, October and December of 2005 and in January and February of this year substantial deficits were recorded.The rising price of oil led to increased imports and an increasing euro led to some dampening of export demand. In March, however, a small surplus was recorded as seasonally adjusted imports declined by 1.5% and exports rose 1.2%. The first chart shows monthly exports and imports of goods for the Euro Zone on a seasonally adjusted basis.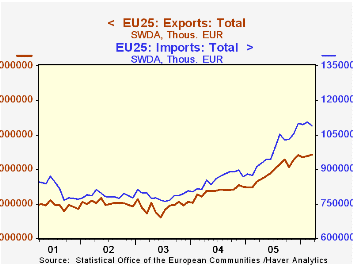
The 25 member European Union as a group has typically runs a deficit of its trade in goods with non EU members as can be seen in the second chart, which shows the gap between imports and exports. The deficit in March was 12.2 billion euros, down from 14.8 billion euros in February but 5.4 billion euros over March 2005. It is not possible to derive the trade balance and exports and imports of the non Euro Zone European Union Members from these series. The Euro Zone data refer to trade with all non Euro Zone countries, including those in the European Union, while the EU25 data refer to trade with non EU countries. However, seasonally adjusted data for the Euro Zone trade balance, imports and exports with major countries and selected groups of countries are available as well as seasonally unadjusted data for the trade balance, imports and exports for each of the EU25 countries.
| Billions of Euros | Mar 06 | Feb 06 | Mar 05 | M/M % | Y/Y % | 2005 | 2004 | 2003 |
|---|---|---|---|---|---|---|---|---|
| Euro Zone Balance on Trade | 0.4 | -2.8 | 2.8 | 3.2* | -2.4* | 23.3 | 72.3 | 69.4 |
| Exports | 111.4 | 110.0 | 97.7 | 1.22 | 13.92 | 1236.0 | 1147.4 | 1060.0 |
| Imports | 111.0 | 112.8 | 94.9 | -1.51 | 17.02 | 1212.7 | 1075.0 | 990.6 |
| European Union Balance on Trade | -12.2 | -14.8 | -8.8 | -2.6* | -3.4* | -106.1 | -620 | -58.6 |
| Exports | 96.5 | 95.8 | 84.5 | 0.73 | 14.26 | 1068.1 | 964.5 | 883.9 |
| Imports | 108.6 | 110.7 | 91.3 | -1.72 | 19.12 | 1174.3 | 1026.6 | 942.5 |

Tom Moeller
AuthorMore in Author Profile »Prior to joining Haver Analytics in 2000, Mr. Moeller worked as the Economist at Chancellor Capital Management from 1985 to 1999. There, he developed comprehensive economic forecasts and interpreted economic data for equity and fixed income portfolio managers. Also at Chancellor, Mr. Moeller worked as an equity analyst and was responsible for researching and rating companies in the economically sensitive automobile and housing industries for investment in Chancellor’s equity portfolio. Prior to joining Chancellor, Mr. Moeller was an Economist at Citibank from 1979 to 1984. He also analyzed pricing behavior in the metals industry for the Council on Wage and Price Stability in Washington, D.C. In 1999, Mr. Moeller received the award for most accurate forecast from the Forecasters' Club of New York. From 1990 to 1992 he was President of the New York Association for Business Economists. Mr. Moeller earned an M.B.A. in Finance from Fordham University, where he graduated in 1987. He holds a Bachelor of Arts in Economics from George Washington University.
More Economy in Brief


