 Global| Sep 15 2004
Industrial Production Up Slightly, Factory Output Firm
by:Tom Moeller
|in:Economy in Brief
Summary
Industrial production rose just 0.1% following an upwardly revised 0.6% gain in July. Market forecasters had looked for a 0.5% increase but the disappointment was that utility output fell 2.4% and mining output fell 1.1%. Production [...]
Industrial production rose just 0.1% following an upwardly revised 0.6% gain in July. Market forecasters had looked for a 0.5% increase but the disappointment was that utility output fell 2.4% and mining output fell 1.1%.
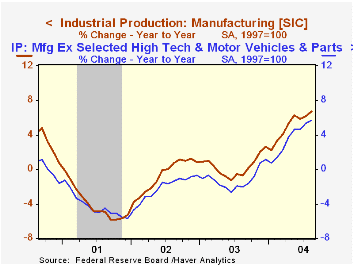
Production in the factory sector rose 0.5% (6.7% y/y) last month following an upwardly revised 0.8% gain in July.
Output of motor vehicles jumped 3.7% (6.1% y/y) following declines in each of the prior five months. Less motor vehicles factory output rose 0.3% (6.8% y/y) in August. The high tech sector continued strong with a 1.8% (23.7% y/y) rise.Factory output elsewhere (excluding motor vehicles & high tech) rose 0.2% (5.7% y/y) following a 0.9% gain in July.
Total capacity utilization was stable at an upwardly revised 77.3%. Growth in capacity inched up to 1.4% y/y from 1.1% earlier this year.
"Predicting the Recent Behavior of Inflation Using Output Gap-Based Phillips Curves" from the Federal Reserve Bank of Richmond is available here.
| Production & Capacity | August | July | Y/Y | 2003 | 2002 | 2001 |
|---|---|---|---|---|---|---|
| Industrial Production | 0.1% | 0.6% | 5.1% | 0.3% | -0.6% | -3.4% |
| Capacity Utilization | 77.3% | 77.3% | 74.5%(8/03) | 74.8% | 75.6% | 77.4% |
by Tom Moeller September 15, 2004
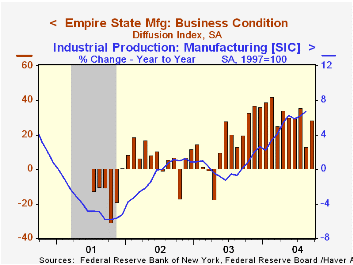
The Empire State Index of General Business Conditions in New York's manufacturing industries recovered most of the prior month's skid with a 15.1 point rise in September to 28.34.
All of the activity components of the survey recovered, especially new orders and shipments.The employment measure, as well, rose notably. Like the Philadelphia Fed Index of General Business Conditions, the Empire State Business Conditions Index reflects answers to an independent survey question; it is not a weighted combination of the components.
The prices paid rose modestly to 51.64 from 50.00 in August but remained below the highs of earlier this year.
Expectations for business conditions six months ahead rose sharply to the highest level since January. Expectations for capital expenditures also jumped to the highest level since April.
The Empire State Manufacturing Survey is a monthly survey of manufacturers in New York State conducted by the Federal Reserve Bank of New York. Participants from across the state in a variety of industries respond to a questionnaire and report the change in a variety of indicators from the previous month. Respondents also state the likely direction of these same indicators six months ahead. April 2002 is the first report, although survey data date back to July 2001.
For more on the Empire State Manufacturing Survey, including methodologies and the latest report, click here.
| Empire State Manufacturing Survey | Sept | Aug | 9/03 | 2003 | 2002 | 2001 |
|---|---|---|---|---|---|---|
| General Business Conditions (diffusion index) | 28.34 | 13.22 | 19.96 | 16.30 | 7.02 | -13.57 |
by Tom Moeller September 15, 2004
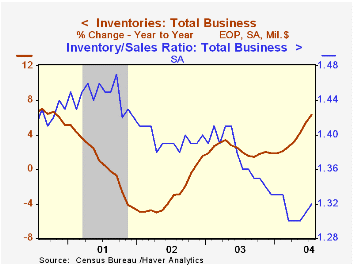
Total business inventories rose 0.9% in July, marking the eleventh consecutive month of accumulation. Consensus expectations were for a 0.7% increase. During the last ten years there has been a 60% correlation between the y/y change in inventories and the change in factory sector industrial production.
Retail inventories rose 0.6%, half the rate of accumulation in June. Higher auto inventories accounted for all of the gain with a 1.8% (12.4% y/y) rise. Non-auto inventories actually fell slightly following five months of moderate accumulation. Apparel (-0.1% y/y) & general merchandise (+3.6% y/y) accounted for the July drop.
Wholesale inventories jumped 1.3%, the third consecutive strong monthly increase. During the last ten years there has been a 62% correlation between the y/y change in wholesale inventories and the change in imports of merchandise.
Overall business sales rose 0.6% (+9.9% y/y).
The ratio of inventories-to-sales rose to 1.32 but remained below the 1.37 averaged last year.
| Business Inventories | July | June | Y/Y | 2003 | 2002 | 2001 |
|---|---|---|---|---|---|---|
| Total | 0.9% | 1.1% | 6.4% | 1.9% | 1.5% | -4.5% |
| Retail | 0.6% | 1.2% | 7.3% | 4.9% | 6.0% | -2.8% |
| Retail excl. Autos | -0.0% | 0.5% | 4.8% | 3.0% | 2.6% | -1.1% |
| Wholesale | 1.3% | 1.1% | 8.6% | 2.2% | 0.4% | -4.5% |
| Manufacturing | 0.8% | 1.0% | 3.9% | -1.3% | -1.8% | -6.1% |
by Tom Moeller September 15, 2004
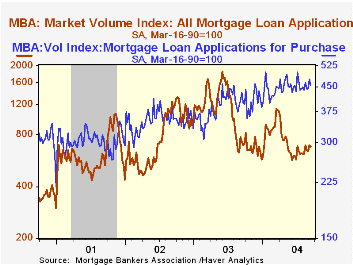
The index of mortgage applications compiled by the Mortgage Bankers Association slipped 2.0% last week following a strong 7.7% gain the week prior. So far in September mortgage applications are 5.6% ahead of August.
Purchase applications fell 4.3% last week, undoing most of the 7.4% rise the prior week. Nevertheless, purchase applications in September are 3.9% higher than in August. During the last ten years there has been a 59% correlation between the y/y change in purchase applications and the change in new plus existing home sales.
Applications to refinance mortgages rose 1.2% following an 8.0% surge the prior week. Refi's in September are 8.1% ahead of August.
The effective interest rate on a conventional 30-year mortgage fell to 5.95% from 6.06% the prior week. In May, 30-year financing averaged 6.53%. The effective rate on a 15-year mortgage fell to 5.38%, down from the 5.97% averaged in May.
The Mortgage Bankers Association surveys between 20 to 35 of the top lenders in the U.S. housing industry to derive its refinance, purchase and market indexes. The weekly survey accounts for more than 40% of all applications processed each week by mortgage lenders. Visit the Mortgage Bankers Association site here.
| MBA Mortgage Applications (3/16/90=100) | 09/10/04 | 09/03/04 | Y/Y | 2003 | 2002 | 2001 |
|---|---|---|---|---|---|---|
| Total Market Index | 678.2 | 692.0 | -6.7% | 1,067.9 | 799.7 | 625.6 |
| Purchase | 455.7 | 476.0 | 5.4% | 395.1 | 354.7 | 304.9 |
| Refinancing | 1,972.5 | 1,948.9 | -19.1% | 4,981.8 | 3,388.0 | 2,491.0 |

Tom Moeller
AuthorMore in Author Profile »Prior to joining Haver Analytics in 2000, Mr. Moeller worked as the Economist at Chancellor Capital Management from 1985 to 1999. There, he developed comprehensive economic forecasts and interpreted economic data for equity and fixed income portfolio managers. Also at Chancellor, Mr. Moeller worked as an equity analyst and was responsible for researching and rating companies in the economically sensitive automobile and housing industries for investment in Chancellor’s equity portfolio. Prior to joining Chancellor, Mr. Moeller was an Economist at Citibank from 1979 to 1984. He also analyzed pricing behavior in the metals industry for the Council on Wage and Price Stability in Washington, D.C. In 1999, Mr. Moeller received the award for most accurate forecast from the Forecasters' Club of New York. From 1990 to 1992 he was President of the New York Association for Business Economists. Mr. Moeller earned an M.B.A. in Finance from Fordham University, where he graduated in 1987. He holds a Bachelor of Arts in Economics from George Washington University.
More Economy in Brief


